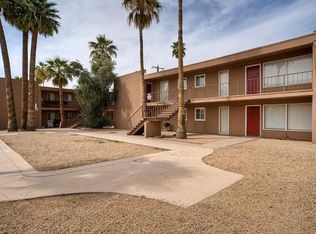
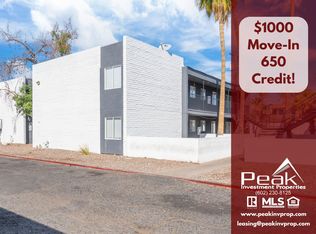
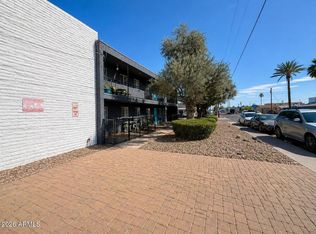
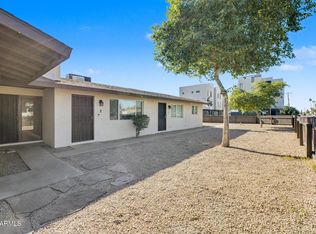
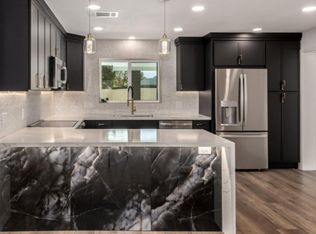
Each unit offers updated kitchens and bathrooms, modern finishes, newer HVAC's, a re-coated roof in 2021, and an in-suite washer and dryer. Residents enjoy a walkable neighborhood just minutes from Arcadia Lite dining, the Camelback Corridor, and major employment centers, including Phoenix Children's Hospital.
Flexible residential financing options are available for small multifamily properties.
Reach out about oportunity to acquire up to 24 units in the immediate area, offering a rare assemblage opportunity in one of Phoenix's most desirable infill neighborhoods.
For sale
Price cut: $49.9K (5/19)
$899,999
2923 N 38TH Street, Phoenix, AZ 85018
6beds
4baths
3,000sqft
Multi Family
Built in 1964
-- sqft lot
$-- Zestimate®
$300/sqft
$-- HOA
What's special
Modern finishesUpdated kitchensIn-suite washer and dryer
- 115 days |
- 105 |
- 9 |
Zillow last checked:
Listing updated:
Listed by:
Cody Leslie 505-980-3726,
Orion Investment Real Estate
Source: ARMLS,MLS#: 6995709
Loading...
Facts & features
Interior
Bedrooms & bathrooms
- Bedrooms: 6
- Bathrooms: 4
Heating
- Forced Air
Cooling
- Central Air, Ceiling Fan(s)
Appliances
- Included: Disposal, Dishwasher, Refrigerator, Free-Standing Electric Oven, Microwave, Washer/Dryer
- Laundry: W/D Hookup
Features
- Flooring: Laminate
Interior area
- Total structure area: 3,000
- Total interior livable area: 3,000 sqft
Property
Parking
- Total spaces: 4
- Parking features: Off Street, Paved, Free, 1 Space/Unit
- Covered spaces: 4
Details
- Parcel number: 12721009C
- Zoning: R-4
Construction
Type & style
- Home type: MultiFamily
- Property subtype: Multi Family
Materials
- Painted, Block
- Roof: Composition
Condition
- Year built: 1964
Utilities & green energy
- Electric: APS
- Sewer: Public Sewer
- Water: City Franchise
Community & HOA
Community
- Features: See Remarks
- Subdivision: CITRUS ACRES LOTS 1 THRU 20
Location
- Region: Phoenix
Financial & listing details
- Price per square foot: $300/sqft
- Tax assessed value: $679,800
- Annual tax amount: $1,654
- Date on market: 3/10/2026
- Cumulative days on market: 116 days
- Listing terms: Conventional,1031 Exchange,FHA,VA Loan
- Ownership: Fee Simple
- Electric utility on property: Yes
- Road surface type: Asphalt
Estimated market value
Not available
Estimated sales range
Not available
Not available
Price history
| Date | Event | Price |
|---|---|---|
| 5/19/2026 | Price change | $899,999-5.3%$300/sqft |
Source: | ||
| 3/9/2026 | Listed for sale | $949,900-19.5%$317/sqft |
Source: | ||
| 12/13/2023 | Listing removed | -- |
Source: | ||
| 7/17/2023 | Listing removed | -- |
Source: Zillow Rentals Report a problem | ||
| 6/26/2023 | Listed for rent | $1,719$1/sqft |
Source: Zillow Rentals Report a problem | ||
| 10/13/2022 | Listing removed | -- |
Source: Zillow Rental Manager Report a problem | ||
| 9/12/2022 | Listed for rent | $1,719$1/sqft |
Source: Zillow Rental Manager Report a problem | ||
| 7/19/2022 | Listing removed | $1,180,000$393/sqft |
Source: | ||
| 6/19/2022 | Price change | $1,180,000-4.5%$393/sqft |
Source: | ||
| 6/3/2022 | Price change | $1,235,000-7.5%$412/sqft |
Source: | ||
| 5/19/2022 | Listed for sale | $1,335,000+97.8%$445/sqft |
Source: | ||
| 5/4/2022 | Listing removed | -- |
Source: Zillow Rental Manager Report a problem | ||
| 3/16/2022 | Listed for rent | $1,719$1/sqft |
Source: Zillow Rental Manager Report a problem | ||
| 12/1/2021 | Sold | $675,000+3.8%$225/sqft |
Source: | ||
| 10/18/2021 | Contingent | $650,000$217/sqft |
Source: | ||
| 10/6/2021 | Listed for sale | $650,000+18.2%$217/sqft |
Source: | ||
| 2/8/2021 | Listing removed | -- |
Source: Local MLS Report a problem | ||
| 10/19/2020 | Sold | $550,000$183/sqft |
Source: | ||
| 8/17/2020 | Price change | $550,000-8.3%$183/sqft |
Source: Launch Real Estate #6103729 Report a problem | ||
| 7/21/2020 | Listed for sale | $600,000+62.2%$200/sqft |
Source: Launch Real Estate #6103729 Report a problem | ||
| 3/15/2019 | Sold | $370,000+64.4%$123/sqft |
Source: Public Record Report a problem | ||
| 4/26/2016 | Sold | $225,000+21.6%$75/sqft |
Source: Public Record Report a problem | ||
| 2/28/2014 | Sold | $185,000+29.4%$62/sqft |
Source: Public Record Report a problem | ||
| 3/20/2012 | Sold | $143,000+34.9%$48/sqft |
Source: Public Record Report a problem | ||
| 3/9/2010 | Sold | $106,000-70.5%$35/sqft |
Source: Public Record Report a problem | ||
| 8/26/2005 | Sold | $359,000+25.3%$120/sqft |
Source: Public Record Report a problem | ||
| 2/17/2005 | Sold | $286,620+43.3%$96/sqft |
Source: Public Record Report a problem | ||
| 12/27/2004 | Sold | $200,000+22.4%$67/sqft |
Source: Public Record Report a problem | ||
| 12/4/2001 | Sold | $163,334$54/sqft |
Source: Public Record Report a problem | ||
Public tax history
| Year | Property taxes | Tax assessment |
|---|---|---|
| 2025 | $1,654 +3.9% | $67,980 -15% |
| 2024 | $1,592 +1.2% | $80,000 +620.5% |
| 2023 | $1,573 +4.1% | $11,104 -73.1% |
| 2022 | $1,511 +0.1% | $41,320 +11.3% |
| 2021 | $1,511 +0.7% | $37,130 +19.9% |
| 2020 | $1,500 +2.1% | $30,970 +23.1% |
| 2019 | $1,469 | $25,150 +14% |
| 2018 | $1,469 +4% | $22,060 +5.2% |
| 2017 | $1,412 +11.8% | $20,960 +21.6% |
| 2016 | $1,263 -1% | $17,230 +12.5% |
| 2015 | $1,275 | $15,310 +18% |
| 2014 | -- | $12,970 +148.5% |
| 2013 | -- | $5,220 +5.7% |
| 2012 | -- | $4,940 -16.8% |
| 2011 | -- | $5,940 -38.4% |
| 2010 | -- | $9,650 -44% |
| 2009 | -- | $17,220 -16% |
| 2008 | -- | $20,500 +23.5% |
| 2007 | -- | $16,600 +28.8% |
| 2006 | -- | $12,890 |
| 2005 | -- | $12,890 +15.9% |
| 2004 | -- | $11,123 |
| 2003 | -- | $11,123 +9.6% |
| 2002 | -- | $10,150 |
Find assessor info on the county website
Monthly payment
Est. payment$--/mo
Payment breakdown
Explore the cost of this home by adjusting the details. Changes won't be saved.All calculations are estimates and provided by Zillow, Inc. for informational purposes only. Actual amounts may vary.
HOA fees may include property taxes on listings classified as Co-Ops. Contact the listing agent and/or owner for fee details.
Mortgage interest rates are dependent on a number of factors, including credit score, down payment, and repayment length. Interest rate data provided by Zillow Group Marketplace, Inc. as of 1/1/1970 from various mortgage lenders with which we have lead or other similar arrangements; the Estimated Payment is an average of those rates.
See how much you could borrow to make a competitive offer.
Climate risks
Neighborhood: Camelback East
Nearby schools
GreatSchools rating
- 3/10Monte Vista Elementary SchoolGrades: PK-8Distance: 0.5 mi
- 3/10Camelback High SchoolGrades: 9-12Distance: 2.2 mi
Schools provided by the listing agent
- District: Creighton Elementary District
Source: ARMLS. This data may not be complete. We recommend contacting the local school district to confirm school assignments for this home.

A local agent can set up tours, give advice and negotiate with sellers.


- Arizona
- Maricopa County
- Phoenix
- 85018
- Camelback East
- 2923 N 38TH Street
Nearby cities
Nearby neighborhoods
Nearby zip codes
Other Phoenix Topics
