Looking for an investment that's already set up and earning? This 2024-built duplex is being sold fully furnished with all contents, and both units are currently operating as mid-term rentals at $2,700 per month each. Each unit has 3 bedrooms, 2 full baths, and 1,250 square feet, one upstairs and one on the main level. Modern finishes throughout keep it looking fresh for guests. Minutes from downtown and the Children's Museum, with quick access to I-65, tenants can easily reach restaurants, shopping, major employers, and the hospitals and universities that keep mid-term demand steady. A turnkey, income-producing property in a neighborhood that keeps getting better.
Pending
$450,000
2931 N Capitol Ave, Indianapolis, IN 46208
3beds
2baths
--sqft
Multi Family, Duplex
Built in 2024
-- sqft lot
$-- Zestimate®
$--/sqft
$-- HOA
What's special
- 2 days
- 42
- 11
Zillow last checked:
Listing updated:
Listed by:
Michelle Romano-Moss mromano103@hotmail.com,
Keller Williams Indpls Metro N
Source: MIBOR as distributed by MLS GRID,MLS#: 22135174
Facts & features
Interior
Bedrooms & bathrooms
- Bedrooms: 3
- Bathrooms: 2
Features
- Has basement: No
Property
Features
- Levels: Two
- Stories: 2
Lot
- Size: 5,227 Square Feet
Details
- Parcel number: 490626171022000101
Construction
Type & style
- Home type: MultiFamily
- Property subtype: Multi Family, Duplex
Condition
- New construction: No
- Year built: 2024
Community & HOA
Community
- Subdivision: Joseph H Clarks N Capitol
Location
- Region: Indianapolis
Financial & listing details
- Tax assessed value: $295,300
- Annual tax amount: $7,046
- Date on market: 11/5/2026
- Cumulative days on market: 5 days
Estimated market value
Not available
Estimated sales range
Not available
Not available
Price history
| Date | Event | Price |
|---|---|---|
| 11/5/2026 | Pending sale | $450,000 |
Source:  MIBOR as distributed by MLS GRID #22135174 Report a problem | ||
| 11/5/2026 | Listed for sale | $450,000+11.1% |
Source: MIBOR as distributed by MLS GRID #22135174 Report a problem | ||
| 10/3/2025 | Sold | $405,000+77.6% |
Source: Public Record Report a problem | ||
| 6/13/2024 | Sold | $228,000+1.3% |
Source: MIBOR as distributed by MLS GRID #21952675 Report a problem | ||
| 5/21/2024 | Pending sale | $225,000 |
Source: MIBOR as distributed by MLS GRID #21952675 Report a problem | ||
| 5/13/2024 | Price change | $225,000-1.1% |
Source: MIBOR as distributed by MLS GRID #21952675 Report a problem | ||
| 4/10/2024 | Pending sale | $227,500 |
Source: MIBOR as distributed by MLS GRID #21952675 Report a problem | ||
| 4/5/2024 | Price change | $227,500-1.1% |
Source: MIBOR as distributed by MLS GRID #21952675 Report a problem | ||
| 2/26/2024 | Listed for sale | $230,000 |
Source: MIBOR as distributed by MLS GRID #21952675 Report a problem | ||
| 2/19/2024 | Pending sale | $230,000 |
Source: MIBOR as distributed by MLS GRID #21952675 Report a problem | ||
| 11/10/2023 | Listed for sale | $230,000-4.1% |
Source: MIBOR as distributed by MLS GRID #21952675 Report a problem | ||
| 11/2/2023 | Listing removed | -- |
Source: MIBOR as distributed by MLS GRID #21898067 Report a problem | ||
| 7/2/2023 | Listed for sale | $239,900 |
Source: MIBOR as distributed by MLS GRID #21898067 Report a problem | ||
| 6/14/2023 | Listing removed | -- |
Source: MIBOR as distributed by MLS GRID #21898067 Report a problem | ||
| 6/13/2023 | Listed for sale | $239,900 |
Source: MIBOR as distributed by MLS GRID #21898067 Report a problem | ||
| 6/1/2023 | Listing removed | -- |
Source: MIBOR as distributed by MLS GRID #21898067 Report a problem | ||
| 5/9/2023 | Listed for sale | $239,900 |
Source: MIBOR as distributed by MLS GRID #21898067 Report a problem | ||
| 4/28/2023 | Pending sale | $239,900 |
Source: MIBOR as distributed by MLS GRID #21898067 Report a problem | ||
| 3/4/2023 | Price change | $239,9000% |
Source: MIBOR as distributed by MLS GRID #21898067 Report a problem | ||
| 1/8/2023 | Listed for sale | $240,000+113.3% |
Source: MIBOR as distributed by MLS GRID #21898067 Report a problem | ||
| 8/3/2021 | Sold | $112,500-6.3% |
Source: Agent Provided Report a problem | ||
| 1/6/2021 | Listing removed | -- |
Source: Owner Report a problem | ||
| 12/23/2020 | Listed for sale | $120,000 |
Source: Owner Report a problem | ||
| 7/7/2020 | Listing removed | $120,000 |
Source: Carpenter Realtors, Inc. #21697072 Report a problem | ||
| 7/7/2020 | Listed for sale | $120,000 |
Source: Carpenter Realtors, Inc. #21697072 Report a problem | ||
| 6/25/2020 | Pending sale | $120,000 |
Source: Carpenter Realtors, Inc. #21697072 Report a problem | ||
| 2/26/2020 | Listed for sale | $120,000+5825.9% |
Source: Carpenter, REALTORS� #21697072 Report a problem | ||
| 1/31/2020 | Listing removed | $1,200 |
Source: SHREENIVASAN Report a problem | ||
| 8/20/2015 | Sold | $2,025-89.9% |
Source: Public Record Report a problem | ||
| 9/25/2013 | Sold | $20,000 |
Source: MIBOR as distributed by MLS GRID #21244972 Report a problem | ||
Public tax history
| Year | Property taxes | Tax assessment |
|---|---|---|
| 2025 | $422 -14.5% | $295,300 +1559% |
| 2024 | $494 +455% | $17,800 |
| 2023 | $89 -96% | $17,800 +456.3% |
| 2022 | $2,217 +25.5% | $3,200 -96.7% |
| 2021 | $1,767 +15.1% | $96,100 +26% |
| 2020 | $1,535 +14% | $76,300 +17.4% |
| 2019 | $1,346 +41.5% | $65,000 +15% |
| 2018 | $951 +3.8% | $56,500 +30.5% |
| 2017 | $917 +6.7% | $43,300 +5.1% |
| 2016 | $859 +4.8% | $41,200 +8.7% |
| 2014 | $819 -39.7% | $37,900 -39% |
| 2013 | $1,359 | $62,100 +2% |
| 2012 | $1,359 | $60,900 -0.5% |
| 2011 | -- | $61,200 |
| 2010 | $1,270 -2.3% | $61,200 |
| 2009 | $1,300 | $61,200 -14% |
| 2007 | -- | $71,200 +23.2% |
| 2006 | -- | $57,800 +1.8% |
| 2005 | -- | $56,800 |
| 2004 | -- | $56,800 |
Find assessor info on the county website
Monthly payment
Est. payment
Payment breakdown
Explore the cost of this home by adjusting the details. Changes won't be saved.Climate risks
Neighborhood: Crown Hill


Similar homes
- $439,0003 bd3 ba2k sqft2853 N Washington Blvd, Indianapolis, IN 46205Active
 MLS ID #22118824, Natalie Clayton, Maywright Property Co.. MIBOR as distributed by MLS GRID
- $252,5004 bd3 ba2.1k sqft2935 N Capitol Ave, Indianapolis, IN 46208Active
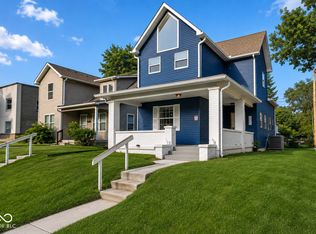 MLS ID #22118728, Courtney Walsh, eXp Realty, LLC. MIBOR as distributed by MLS GRID
- $549,9994 bd7 ba5.5k sqft3326 Ruckle St, Indianapolis, IN 46205Active
 MLS ID #22133676, Alexandria Heygood, Highgarden Real Estate. MIBOR as distributed by MLS GRID
- $239,9003 bd2 ba1.7k sqft2701 Ethel Ave, Indianapolis, IN 46208Active
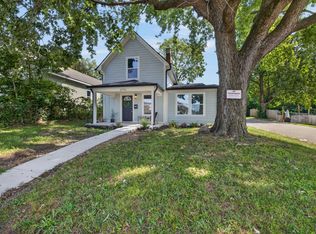 MLS ID #22126099, Stacey Brown, Keller Williams Indy Metro NE. MIBOR as distributed by MLS GRID
