This 1559 square foot single family home has 4 bedrooms and 2.5 bathrooms. This home is located at 3611 W 114th Pl, Chicago, IL 60655.
Foreclosed
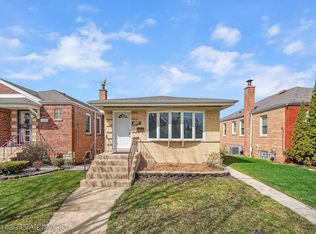
Street View
Est. $412,000
3611 W 114th Pl, Chicago, IL 60655
4beds
2baths
1,559sqft
SingleFamily
Built in 1961
5,400 Square Feet Lot
$412,000 Zestimate®
$264/sqft
$-- HOA
Overview
- 151 days |
- 12 |
- 1 |
Facts & features
Interior
Bedrooms & bathrooms
- Bedrooms: 4
- Bathrooms: 2.5
Heating
- Other
Cooling
- None
Interior area
- Total interior livable area: 1,559 sqft
Property
Parking
- Parking features: Garage - Attached
Features
- Exterior features: Stone
Lot
- Size: 5,400 Square Feet
Details
- Parcel number: 2423107088
Construction
Type & style
- Home type: SingleFamily
Materials
- Roof: Shake / Shingle
Condition
- Year built: 1961
Community & HOA
Location
- Region: Chicago
Financial & listing details
- Price per square foot: $264/sqft
- Tax assessed value: $340,000
Visit our professional directory to find a foreclosure specialist in your area that can help with your home search.
Find a foreclosure agentForeclosure details
Estimated market value
$412,000
$375,000 - $449,000
$3,281/mo
Price history
| Date | Event | Price |
|---|---|---|
| 5/31/2024 | Listing removed | -- |
Source: | ||
| 5/3/2024 | Listed for sale | $345,000$221/sqft |
Source: | ||
Public tax history
| Year | Property taxes | Tax assessment |
|---|---|---|
| 2024 | -- | $34,000 +36% |
| 2023 | $4,025 +7.5% | $25,000 |
| 2022 | $3,746 +1.3% | $25,000 |
| 2021 | $3,698 -12.8% | $25,000 -7.7% |
| 2020 | $4,241 +0.3% | $27,079 -8% |
| 2019 | $4,229 +1.5% | $29,434 |
| 2018 | $4,165 -6.6% | $29,434 -0.8% |
| 2017 | $4,458 -12.6% | $29,686 |
| 2016 | $5,100 +10.2% | $29,686 |
| 2015 | $4,627 +22.5% | $29,686 +20.2% |
| 2014 | $3,776 +2.6% | $24,704 |
| 2013 | $3,682 -17.1% | $24,704 |
| 2012 | $4,443 +16.1% | $24,704 -14.7% |
| 2011 | $3,826 -18.9% | $28,945 |
| 2010 | $4,720 +38.4% | $28,945 |
| 2009 | $3,410 +5.7% | $28,945 -5.1% |
| 2008 | $3,225 +12.7% | $30,498 |
| 2007 | $2,862 +19% | $30,498 |
| 2006 | $2,406 -5.8% | $30,498 +46.6% |
| 2005 | $2,553 +2.4% | $20,799 |
| 2004 | $2,494 +3.6% | $20,799 |
| 2003 | $2,407 -11.3% | $20,799 +23% |
| 2002 | $2,714 +13.7% | $16,906 |
| 2001 | $2,387 -16.2% | $16,906 |
| 2000 | $2,848 -0.2% | $16,906 +0.6% |
| 1999 | $2,854 | $16,801 |
Find assessor info on the county website
Monthly payment
Estimated monthly payment$1,822
All calculations are estimates and provided by Zillow, Inc. for informational purposes only. Actual amounts may vary.
HOA fees may include property taxes on listings classified as Co-Ops. Contact the listing agent and/or owner for fee details.
Mortgage interest rates are dependent on a number of factors, including credit score, down payment, and repayment length. Interest rate data provided by Zillow Group Marketplace, Inc. as of 1/1/1970 from various mortgage lenders with which we have lead or other similar arrangements; the Estimated Payment is an average of those rates.
See how much you could borrow to make a competitive offer.
Climate risks
Neighborhood: Mount Greenwood Heights
Nearby schools
GreatSchools rating
- 8/10Cassell Elementary SchoolGrades: K-8Distance: 0.4 mi
- 4/10Morgan Park High SchoolGrades: 7-12Distance: 2.4 mi


- Illinois
- Cook County
- Chicago
- 60655
- Mount Greenwood Heights
- 3611 W 114th Pl
Nearby cities
Nearby neighborhoods
Nearby zip codes
Other Chicago Topics
