This townhome is a rare find in NE Ocala! This charming, bright, and well kept end unit 2 bedroom, 1.5 bath townhome is ready for its new owners. It features a brand NEW ROOF, and, as an added bonus, NO HOA! Downstairs you'll find a well equipped kitchen and pantry, half bath, and, large living area. You also have a private patio outside of the sliding glass doors. Upstairs you have 2 bedrooms, and, a jack and jill style bathroom for convenience. Because this is an end unit you'll have plenty of natural light with the large windows on 3 sides of the townhome. With its close proximity to Silver Springs Blvd you have restaurants, grocery, gas, and more right around the corner. And, you can jump into nature at Silver Springs State Park, and, many of the other natural springs, hiking/biking trails, and, more in our surrounding area. At the price it's great for the investor, or, first time homeowner. Reach out to your trusted local Realtor today!
Pre-foreclosure
Est. $136,700
3650 NE 21st St, Ocala, FL 34470
2beds
1,178sqft
Townhouse
Built in 1984
871 Square Feet Lot
$136,700 Zestimate®
$116/sqft
$-- HOA
Overview
- 183 days
- 12
- 1
Facts & features
Interior
Bedrooms & bathrooms
- Bedrooms: 2
- Bathrooms: 2
- Full bathrooms: 1
- 1/2 bathrooms: 1
Heating
- Forced air
Features
- Flooring: Carpet
- Has fireplace: No
Interior area
- Total interior livable area: 1,178 sqft
Property
Features
- Exterior features: Cement / Concrete
Lot
- Size: 871 Square Feet
Details
- Parcel number: 2726710105
Construction
Type & style
- Home type: Townhouse
Materials
- Foundation: Concrete Block
- Roof: Other
Condition
- Year built: 1984
Community & HOA
Location
- Region: Ocala
Financial & listing details
- Price per square foot: $116/sqft
- Tax assessed value: $121,078
- Annual tax amount: $1,681
Foreclosure details
Estimated market value
$136,700
$126,000 - $148,000
$1,232/mo
Price history
| Date | Event | Price |
|---|---|---|
| 8/23/2025 | Listing removed | $154,000$131/sqft |
Source:  Stellar MLS #OM696319 Report a problem | ||
| 5/23/2025 | Price change | $154,000-3.6%$131/sqft |
Source: Stellar MLS #OM696319 Report a problem | ||
| 4/18/2025 | Price change | $159,800-3%$136/sqft |
Source: Stellar MLS #OM696319 Report a problem | ||
| 3/3/2025 | Listed for sale | $164,800+21.2%$140/sqft |
Source: Stellar MLS #OM696319 Report a problem | ||
| 7/15/2022 | Sold | $136,000-1.1%$115/sqft |
Source: Public Record Report a problem | ||
| 6/6/2022 | Pending sale | $137,500$117/sqft |
Source: Stellar MLS #OM637703 Report a problem | ||
| 6/2/2022 | Listed for sale | $137,500$117/sqft |
Source: Stellar MLS #OM637703 Report a problem | ||
| 4/22/2022 | Pending sale | $137,500$117/sqft |
Source: Stellar MLS #OM637703 Report a problem | ||
| 4/19/2022 | Listed for sale | $137,500+475.3%$117/sqft |
Source: Stellar MLS #OM637703 Report a problem | ||
| 10/28/2014 | Sold | $23,900-73.4%$20/sqft |
Source: Stellar MLS #OM412392 Report a problem | ||
| 1/18/2006 | Sold | $90,000$76/sqft |
Source: Public Record Report a problem | ||
Public tax history
| Year | Property taxes | Tax assessment |
|---|---|---|
| 2025 | $1,681 -0.6% | $121,078 +0.9% |
| 2024 | $1,691 -24.4% | $120,053 +9.4% |
| 2023 | $2,237 +419.2% | $109,757 +177% |
| 2022 | $431 +2.6% | $39,623 +3% |
| 2021 | $420 +77.4% | $38,469 +1.4% |
| 2020 | $237 +6% | $37,938 +2.3% |
| 2019 | $223 | $37,085 +1.9% |
| 2018 | $223 +13.5% | $36,394 +2.1% |
| 2017 | $197 +7.1% | $35,645 +2.1% |
| 2016 | $184 | $34,912 +0.7% |
| 2015 | $184 +194% | $34,669 +21.5% |
| 2014 | $62 +12.6% | $28,534 +1.5% |
| 2013 | $55 +16.3% | $28,112 +1.7% |
| 2012 | $48 +45.3% | $27,642 +3% |
| 2011 | $33 -88.7% | $26,837 -35.7% |
| 2010 | $291 -33.4% | $41,720 -20.4% |
| 2009 | $437 -33.2% | $52,419 -33.3% |
| 2008 | $654 -20.5% | $78,587 +3% |
| 2007 | $823 -39% | $76,299 +5.2% |
| 2006 | $1,348 +62.1% | $72,561 +73.6% |
| 2005 | $832 | $41,790 +0.4% |
| 2004 | $832 -4.1% | $41,643 +4.3% |
| 2002 | $867 +3.1% | $39,945 +5.1% |
| 2001 | $841 | $37,991 |
| 2000 | $841 | $37,991 |
Find assessor info on the county website
Monthly payment
Climate risks
Neighborhood: 34470
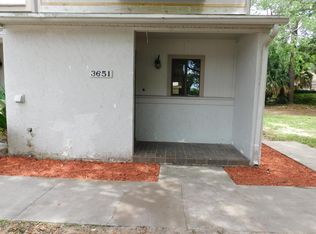
Similar homes
- $--2 bd2 ba1.2k sqft6810 NE 5th Pl, Ocala, FL 34470AuctionServiceLink Auction
- $124,9002 bd2 ba1.1k sqft3625 NE 20TH PLACE, OCALA, FL 34470For Sale
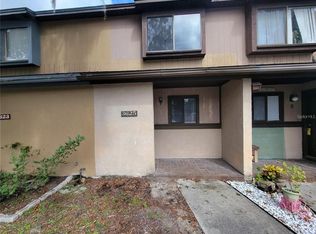
 MLS ID #OM711715, Nicholas Weitlauf, HOMERUN REALTY. Stellar MLS
- $150,0002 bd2 ba1.1k sqft1605 NE 38TH TERRACE, OCALA, FL 34470For Sale
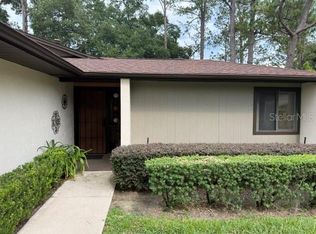 MLS ID #OM730008, Remy Perez, HOOK & LADDER REALTY OF CENTRAL FLORIDA, LLC. Stellar MLS
- $110,0002 bd2 ba924 sqft2701 NE 10TH STREET #601, OCALA, FL 34470For Sale
 MLS ID #OM735341, Joshua Henry, HOOK & LADDER REALTY OF CENTRAL FLORIDA, LLC. Stellar MLS
- $135,0002 bd2 ba1k sqft3800 E SILVER SPRINGS BOULEVARD #10, OCALA, FL 34470For SaleMLS ID #OM734063, Christie Casey, RE/MAX ALLSTARS REALTY. Stellar MLS
- $149,9002 bd3 ba1.1k sqft2701 NE 10TH STREET #703, OCALA, FL 34470For SaleMLS ID #CC855823, Wendy Everett, THE HOLLOWAY GROUP. Stellar MLS
- $140,0002 bd2 ba1k sqft3525 E FORT KING STREET #G-138, OCALA, FL 34470For SaleMLS ID #OM734435, Matt Taylor, CB/ELLISON RLTY WEST. Stellar MLS
- $184,9003 bd2 ba1.2k sqft3802 NE 17TH STREET CIRCLE, OCALA, FL 34470For SaleMLS ID #OM735590, Doug Gulick, ABC REALTY OF OCALA. Stellar MLS
- $132,5002 bd2 ba902 sqft2701 NE 10TH STREET #802, OCALA, FL 34470For SaleMLS ID #OM731841, Nicole Garcia, REAL BROKER, LLC. Stellar MLS
- $177,8002 bd2 ba1.2k sqft2115 NE 38TH AVENUE, OCALA, FL 34470For SaleMLS ID #OM720604, Arika Johnson, PLATINUM HOMES AND LAND REALTY. Stellar MLS
- $139,9002 bd2 ba1k sqft3630 NE 8TH PLACE #203, OCALA, FL 34470For SaleMLS ID #O6432268, Mary Abbott, REALTY ONE GROUP MVP. Stellar MLS
- $134,9002 bd2 ba1k sqft2635 NE 7TH STREET #102, OCALA, FL 34470For SaleMLS ID #O6437792, Kevin Asenjo, COLDWELL BANKER REALTY. Stellar MLS
- $139,9002 bd2 ba1.1k sqft2837 NE 3RD STREET #102, OCALA, FL 34470For SaleMLS ID #O6391932, Alissa Williams, MAGNOLIA & MAIN REALTY ADVISORS LLC. Stellar MLS
- $122,9972 bd2 ba924 sqft2701 NE 10TH STREET #708, OCALA, FL 34470For SaleMLS ID #OM707514, Hope Deszell, RE/MAX FOXFIRE - HWY 40. Stellar MLS
- $195,0002 bd2 ba1.1k sqft3867 NE 17TH STREET CIRCLE, OCALA, FL 34470For SaleMLS ID #OM728310, Crystal Snook, CRYSTAL SNOOK REAL ESTATE. Stellar MLS
- $136,0002 bd2 ba1.2k sqft4601 NE 20TH AVENUE, OCALA, FL 34479For SaleMLS ID #S5156580, Yesenia Carriedo, REALTYCITY INC. Stellar MLS
- $149,9002 bd2 ba924 sqft2701 NE 10TH STREET #401, OCALA, FL 34470For SaleMLS ID #G5117190, Danielle Mojica, SALLY LOVE REAL ESTATE. Stellar MLS
- $123,9002 bd2 ba1.1k sqft2837 NE 3RD STREET #103, OCALA, FL 34470For SaleMLS ID #OM730044, Elisha Lopez, REAL BROKER, LLC. Stellar MLS
- $199,9003 bd2 ba1.2k sqft3804 NE 17TH STREET CIRCLE, OCALA, FL 34470For SaleMLS ID #GC544208, Heather Surrency-Bristow, WATSON REALTY CORP. Stellar MLS
- $110,0004 bd2 ba1.7k sqft1517 NE 12th St, Ocala, FL 34470Active
 MLS ID #10886405, Jamie L Boone, Federa. GAMLS
