$405,800
-- bd|1 ba|900 sqft
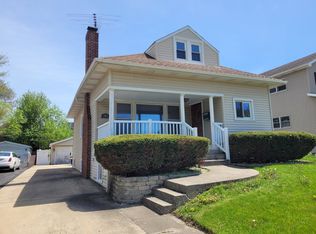
371 N Oak St, Elmhurst, IL 60126
Off Market
Zillow last checked:
Maria Verbena 630-742-7275,
L.W. Reedy Real Estate
Not available
Estimated sales range
Not available
Not available
| Date | Event | Price |
|---|---|---|
| 6/1/2026 | Listing removed | $1,720,000$452/sqft |
Source: MRED as distributed by MLS GRID #12634988 Report a problem | ||
| 4/30/2026 | Listed for sale | $1,720,000+1.2%$452/sqft |
Source: | ||
| 4/30/2026 | Listing removed | $1,699,000$447/sqft |
Source: | ||
| 3/16/2026 | Price change | $1,699,000+1.4%$447/sqft |
Source: | ||
| 1/10/2026 | Listed for sale | $1,675,000+300.7%$440/sqft |
Source: | ||
| 2/4/2025 | Sold | $418,000-11%$110/sqft |
Source: | ||
| 11/19/2024 | Listed for sale | $469,900$124/sqft |
Source: | ||
| 11/18/2024 | Listing removed | $469,900$124/sqft |
Source: | ||
| 11/12/2024 | Price change | $469,900-2.9%$124/sqft |
Source: | ||
| 11/9/2024 | Price change | $484,000-1.2%$127/sqft |
Source: | ||
| 10/30/2024 | Price change | $489,900-1%$129/sqft |
Source: | ||
| 10/24/2024 | Price change | $494,900-1%$130/sqft |
Source: | ||
| 10/22/2024 | Listed for sale | $499,900+344.4%$131/sqft |
Source: | ||
| 3/1/1988 | Sold | $112,500$30/sqft |
Source: Agent Provided Report a problem | ||
| Year | Property taxes | Tax assessment |
|---|---|---|
| 2024 | $7,802 +9.1% | $143,394 +8.8% |
| 2023 | $7,148 +1.4% | $131,820 +4.5% |
| 2022 | $7,052 +0.1% | $126,130 +4.4% |
| 2021 | $7,042 +6.3% | $120,810 +4.4% |
| 2020 | $6,623 +1.1% | $115,710 +4% |
| 2019 | $6,553 +7% | $111,260 +7.2% |
| 2018 | $6,122 +2% | $103,750 +4.6% |
| 2017 | $5,999 +4.5% | $99,150 +8.3% |
| 2016 | $5,741 +2.1% | $91,540 +8.3% |
| 2015 | $5,622 +13.2% | $84,560 +21.2% |
| 2014 | $4,965 +0.4% | $69,770 -2% |
| 2013 | $4,947 +2% | $71,190 -6.3% |
| 2012 | $4,852 +1.9% | $76,010 -10.1% |
| 2011 | $4,764 -8.1% | $84,560 -15.5% |
| 2010 | $5,185 +1.3% | $100,040 -9.1% |
| 2009 | $5,121 +5.8% | $110,000 |
| 2008 | $4,840 +3.8% | $110,000 +7.6% |
| 2007 | $4,664 +3.7% | $102,230 +8.4% |
| 2006 | $4,497 +5.3% | $94,280 +8% |
| 2005 | $4,270 +10.7% | $87,290 +6.5% |
| 2004 | $3,856 +2.1% | $81,960 +9% |
| 2003 | $3,776 +2.5% | $75,190 +10.2% |
| 2002 | $3,683 +6.5% | $68,250 +8.1% |
| 2001 | $3,458 +4.1% | $63,130 +5.8% |
| 2000 | $3,323 | $59,660 |
Find assessor info on the county website
Source: MRED as distributed by MLS GRID. This data may not be complete. We recommend contacting the local school district to confirm school assignments for this home.
A local agent can set up tours, give advice and negotiate with sellers.
A local lender can help you make sure your offer is ready when you are.