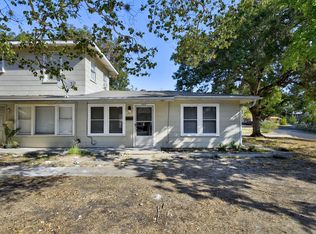
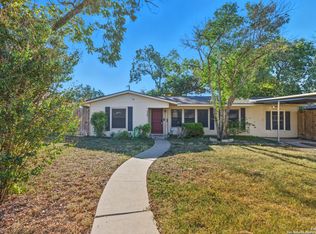
Welcome to 369 Babcock, where charm meets convenience in this well-maintained, fully occupied duplex nestled on a sprawling corner lot in a prime location. Tenant 1 is on a month-to-month, while Tenant 2 is approaching vacancy. Whether you're an investor or a homeowner, this property offers excellent investment potential. Conveniently located on a corner lot, it is minutes from St. Mary's University and Woodlawn Lake and within a short drive to Downtown, the Riverwalk, The Pearl, La Cantera, The Rim, Six Flags, Sea World, AT&T Center, Alamodome, and Lackland AFB. Don't miss the chance to make this home your new home or investment property!
For sale
Price cut: $10K (6/16)
$365,000
369 BABCOCK RD, San Antonio, TX 78201
4beds
1,968sqft
Multi Family
Built in 1950
-- sqft lot
$358,300 Zestimate®
$185/sqft
$-- HOA
What's special
Sprawling corner lot
- 59 days |
- 181 |
- 4 |
Zillow last checked:
Listing updated:
Listed by:
Montana Kloss TREC #721837 (832) 588-5965,
eXp Realty
Source: LERA MLS,MLS#: 1962226
Loading...
Facts & features
Interior
Bedrooms & bathrooms
- Bedrooms: 4
- Bathrooms: 2
- Full bathrooms: 2
Heating
- Central, Electric
Cooling
- Unit Central, Two Central
Appliances
- Included: Oven, Disposal, Dishwasher, Refrigerator
Features
- Flooring: Ceramic Tile, Vinyl
- Windows: Window Coverings
- Has basement: No
Interior area
- Total interior livable area: 1,968 sqft
Property
Parking
- Total spaces: 4
- Parking features: Attached
- Has attached garage: Yes
Features
- Levels: Two
- Stories: 2
Lot
- Size: 10,101 Square Feet
- Residential vegetation: Mature Trees
Details
- Parcel number: 098240020130
- Zoning description: R-4
Construction
Type & style
- Home type: MultiFamily
- Property subtype: Multi Family
Materials
- Siding, Vinyl Siding
- Foundation: Slab
- Roof: Composition
Condition
- Year built: 1950
Utilities & green energy
- Electric: CPS, Separate Electric Meter(s)
- Gas: Separate Gas Meter(s)
- Water: SAWS, Separate Water Meter(s)
Community & HOA
Community
- Subdivision: Monticello Heights
Location
- Region: San Antonio
Financial & listing details
- Price per square foot: $185/sqft
- Tax assessed value: $217,598
- Annual tax amount: $5,310
- Price range: $365K - $365K
- Date on market: 4/29/2026
- Cumulative days on market: 60 days
- Listing terms: Conventional,FHA,VA Loan,Cash,Investors OK
- Total actual rent: 2496
Estimated market value
$358,300
$340,000 - $376,000
$1,175/mo
Price history
| Date | Event | Price |
|---|---|---|
| 6/16/2026 | Price change | $365,000-2.7%$185/sqft |
Source: | ||
| 5/19/2026 | Price change | $375,000-6.2%$191/sqft |
Source: | ||
| 4/29/2026 | Listed for sale | $399,999$203/sqft |
Source: | ||
| 8/29/2013 | Sold | -- |
Source: | ||
| 5/10/2004 | Sold | -- |
Source: | ||
Public tax history
| Year | Property taxes | Tax assessment |
|---|---|---|
| 2025 | $5,310 +0% | $217,598 |
| 2024 | $5,310 +3.7% | $217,598 +5.9% |
| 2023 | $5,123 -5.5% | $205,500 +2.8% |
| 2022 | $5,419 | $200,000 +6.1% |
| 2021 | -- | $188,570 +1.9% |
| 2020 | -- | $185,030 +43.9% |
| 2019 | $3,645 | $128,610 |
| 2018 | $3,645 +3.5% | $128,610 +3.6% |
| 2017 | $3,521 +1.9% | $124,090 +1.3% |
| 2016 | $3,457 +24.1% | $122,480 +3% |
| 2015 | $2,786 | $118,920 +15.5% |
| 2014 | $2,786 | $102,980 -12.4% |
| 2013 | -- | $117,560 -1% |
| 2012 | -- | $118,700 -1% |
| 2011 | -- | $119,840 -1% |
| 2010 | -- | $120,990 -13.7% |
| 2009 | -- | $140,210 -4.3% |
| 2008 | -- | $146,460 +5.1% |
| 2007 | -- | $139,320 +30.1% |
| 2006 | -- | $107,110 +20.9% |
| 2005 | -- | $88,620 |
| 2004 | -- | -- |
| 2003 | -- | -- |
| 2002 | -- | -- |
| 2001 | -- | -- |
| 2000 | -- | -- |
Find assessor info on the county website
Monthly payment
Est. payment$--/mo
Payment breakdown
Explore the cost of this home by adjusting the details. Changes won't be saved.All calculations are estimates and provided by Zillow, Inc. for informational purposes only. Actual amounts may vary.
HOA fees may include property taxes on listings classified as Co-Ops. Contact the listing agent and/or owner for fee details.
Mortgage interest rates are dependent on a number of factors, including credit score, down payment, and repayment length. Interest rate data provided by Zillow Group Marketplace, Inc. as of 1/1/1970 from various mortgage lenders with which we have lead or other similar arrangements; the Estimated Payment is an average of those rates.
See how much you could borrow to make a competitive offer.
Climate risks
Neighborhood: Laddie Place and North Wilson
Getting around
50 / 100
Good TransitNearby schools
GreatSchools rating
- 5/10Maverick Elementary SchoolGrades: PK-5Distance: 0.5 mi
- 3/10Longfellow Middle SchoolGrades: 6-8Distance: 1.3 mi
- 3/10Jefferson High SchoolGrades: 9-12Distance: 0.6 mi
Schools provided by the listing agent
- Elementary: Maverick
- Middle: Longfellow
- High: Jefferson
- District: San Antonio I.S.D.
Source: LERA MLS. This data may not be complete. We recommend contacting the local school district to confirm school assignments for this home.
A local agent can set up tours, give advice and negotiate with sellers.
A local lender can help you make sure your offer is ready when you are.


Nearby cities
Nearby neighborhoods
Nearby zip codes
Other San Antonio Topics
