This 1268 square foot single family home has 4 bedrooms and 2.0 bathrooms. This home is located at 3801 Budlong Ave, Las Vegas, NV 89110.
Pre-foreclosure
Street View
Est. $356,000
3801 Budlong Ave, Las Vegas, NV 89110
4beds
2baths
1,268sqft
SingleFamily
Built in 1970
6,969 Square Feet Lot
$356,000 Zestimate®
$281/sqft
$-- HOA
Overview
- 183 days
- 3
- 0
Facts & features
Interior
Bedrooms & bathrooms
- Bedrooms: 4
- Bathrooms: 2
Heating
- Forced air
Cooling
- Central
Features
- Flooring: Carpet, Hardwood, Linoleum / Vinyl
Interior area
- Total interior livable area: 1,268 sqft
Property
Features
- Exterior features: Stucco
Lot
- Size: 6,969 Square Feet
Details
- Parcel number: 14031311021
Construction
Type & style
- Home type: SingleFamily
Materials
- Frame
- Roof: Composition
Condition
- Year built: 1970
Community & HOA
Location
- Region: Las Vegas
Financial & listing details
- Price per square foot: $281/sqft
- Tax assessed value: $127,091
- Annual tax amount: $1,173
Foreclosure details
Estimated market value
$356,000
$338,000 - $374,000
$2,033/mo
Price history
| Date | Event | Price |
|---|---|---|
| 5/16/2022 | Sold | $327,000+2.5%$258/sqft |
Source:  LVR #2378853 Report a problem | ||
| 4/7/2022 | Pending sale | $319,000$252/sqft |
Source: LVR #2378853 Report a problem | ||
| 4/6/2022 | Listed for sale | $319,000$252/sqft |
Source: LVR #2378853 Report a problem | ||
| 4/1/2022 | Pending sale | $319,000$252/sqft |
Source: LVR #2378853 Report a problem | ||
| 4/1/2022 | Listed for sale | $319,000+93.3%$252/sqft |
Source: LVR #2378853 Report a problem | ||
| 11/4/2021 | Sold | $165,000$130/sqft |
Source: Public Record Report a problem | ||
| 11/13/2020 | Sold | $165,000$130/sqft |
Source: Public Record Report a problem | ||
Public tax history
| Year | Property taxes | Tax assessment |
|---|---|---|
| 2026 | $1,173 +9.1% | $44,482 +5.4% |
| 2025 | $1,075 +40.3% | $42,216 -0.4% |
| 2024 | $767 +21.7% | $42,379 +25.8% |
| 2023 | $630 +8% | $33,684 +9% |
| 2022 | $584 +7.8% | $30,902 -1.2% |
| 2021 | $541 +3.1% | $31,290 +4.9% |
| 2020 | $525 +3% | $29,833 +5.4% |
| 2019 | $510 +5.7% | $28,295 |
| 2018 | $483 | $28,295 +8.5% |
| 2017 | $483 | $26,069 +23.9% |
| 2016 | $483 +0.5% | $21,039 +20.2% |
| 2015 | $480 +3% | $17,506 +21.8% |
| 2014 | $466 | $14,371 |
| 2013 | -- | $14,371 -2.3% |
| 2012 | -- | $14,703 +13.1% |
| 2011 | -- | $13,003 -4.3% |
| 2010 | -- | $13,589 -49.3% |
| 2009 | -- | $26,789 |
| 2008 | -- | $26,789 -40.6% |
| 2007 | -- | $45,075 +26.7% |
| 2006 | -- | $35,590 +30.5% |
| 2005 | -- | $27,269 +8.7% |
| 2004 | -- | $25,081 +10% |
| 2003 | -- | $22,796 -6.5% |
| 2002 | -- | $24,390 +1.7% |
| 2001 | -- | $23,990 |
Find assessor info on the county website
Monthly payment
Climate risks
Neighborhood: Downtown East

Similar homes
- $359,0004 bd2 ba1.1k sqft213 Ronald Ln, Las Vegas, NV 89110For Sale
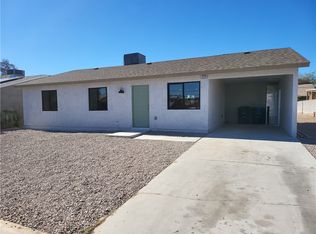 MLS ID #2829915, Greg Deville, DeVille Realty Group. LVR
- $380,0004 bd2 ba1.1k sqft3982 Saguaro Ln, Las Vegas, NV 89110For Sale
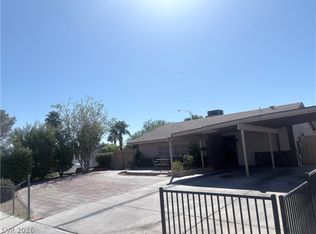 MLS ID #2820378, Gabriela A. Fabela De Talavera, United Realty Group. LVR
- $359,0004 bd3 ba1.5k sqft500 Kuilima Rd, Las Vegas, NV 89110For Sale
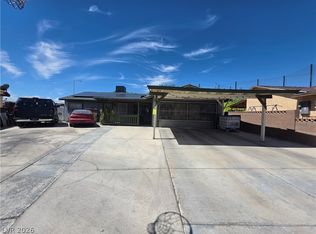 MLS ID #2818550, Sandra Flores-Banyai, United Realty Group. LVR
- $359,0004 bd2 ba1.2k sqft4417 E Ogden Ave, Las Vegas, NV 89110For Sale
 MLS ID #2800546, Tania Sperlonga, Keller Williams MarketPlace. LVR
