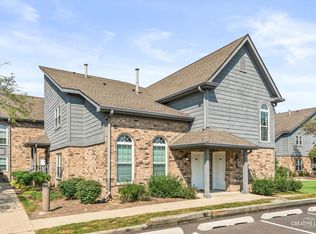
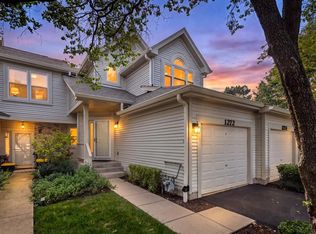
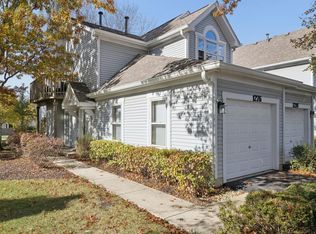
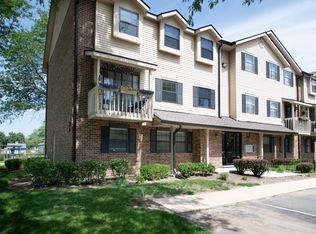
$236,300
2 bd2 ba1k sqft
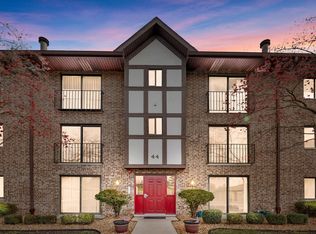
44 Harbor Ct APT 204, Naperville, IL 60565
Off Market

Listing description withheld by the listing agent.
Zillow last checked:
Listing updated:
Julie Michael, GRI (630)661-7109,
Keller Williams Infinity

Not available
Estimated sales range
Not available
Not available
| Date | Event | Price |
|---|---|---|
| 10/7/2026 | Contingent | $260,000$239/sqft |
Source:  MRED as distributed by MLS GRID #12774353 Report a problem | ||
| 10/1/2026 | Listed for sale | $260,000+89.8%$239/sqft |
Source: MRED as distributed by MLS GRID #12774353 Report a problem | ||
| 1/21/2016 | Sold | $137,000-6.7%$126/sqft |
Source: MRED as distributed by MLS GRID #09037914 Report a problem | ||
| 12/8/2015 | Pending sale | $146,900$135/sqft |
Source: Baird & Warner #09037914 Report a problem | ||
| 11/14/2015 | Price change | $146,900-2%$135/sqft |
Source: Baird & Warner #09037914 Report a problem | ||
| 10/13/2015 | Price change | $149,900-2.6%$138/sqft |
Source: Baird & Warner #09037914 Report a problem | ||
| 9/14/2015 | Listed for sale | $153,900+45.2%$141/sqft |
Source: Baird & Warner #09037914 Report a problem | ||
| 3/24/1999 | Sold | $106,000-1.9%$97/sqft |
Source: Public Record Report a problem | ||
| 7/30/1996 | Sold | $108,000$99/sqft |
Source: Public Record Report a problem | ||
| Year | Property taxes | Tax assessment |
|---|---|---|
| 2025 | $3,481 +4.6% | $67,639 +8.5% |
| 2024 | $3,328 +4.8% | $62,323 +9.6% |
| 2023 | $3,176 +7.4% | $56,880 +10% |
| 2022 | $2,958 +4.2% | $51,710 +3.9% |
| 2021 | $2,840 +2.3% | $49,750 +1.8% |
| 2020 | $2,775 +3.5% | $48,860 +4.5% |
| 2019 | $2,682 +5.6% | $46,740 +4.9% |
| 2018 | $2,539 +2.4% | $44,570 +3.5% |
| 2017 | $2,479 +2.5% | $43,070 +3.8% |
| 2016 | $2,419 +1.4% | $41,510 +6.2% |
| 2015 | $2,385 -3.2% | $39,090 |
| 2014 | $2,463 -5.6% | $39,090 -6.2% |
| 2013 | $2,609 -1.3% | $41,680 -7% |
| 2012 | $2,642 +0.9% | $44,830 -5.9% |
| 2011 | $2,618 -7% | $47,660 -11.3% |
| 2010 | $2,815 +0.8% | $53,740 -5% |
| 2009 | $2,792 +2.2% | $56,560 +1.4% |
| 2008 | $2,731 +4.6% | $55,780 +5.9% |
| 2007 | $2,611 +7.1% | $52,670 +9% |
| 2006 | $2,439 +4.1% | $48,320 +6.7% |
| 2005 | $2,343 +2.9% | $45,290 +5.9% |
| 2004 | $2,277 +3.6% | $42,770 +8.4% |
| 2003 | $2,198 -1.6% | $39,460 -0.7% |
| 2002 | $2,234 +7.9% | $39,740 +7.5% |
| 2001 | $2,071 +14.1% | $36,960 +5.9% |
| 2000 | $1,815 | $34,900 |
Source: MRED as distributed by MLS GRID. This data may not be complete. We recommend contacting the local school district to confirm school assignments for this home.


A local agent can set up tours, give advice and negotiate with sellers.
A local lender can help you make sure your offer is ready when you are.