$490,800
2 bd|2 ba|1.5k sqft
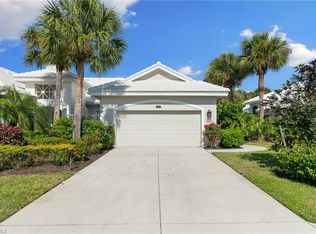
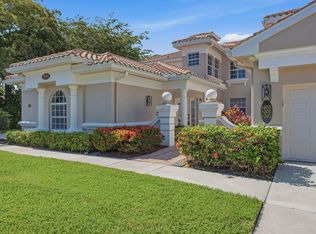
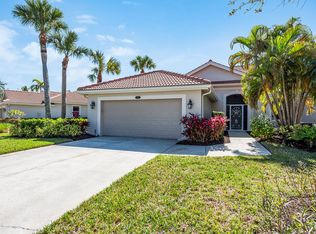
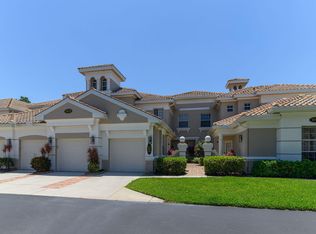
4505 Cardinal Cove Ln, Naples, FL 34114
Off Market
Zillow last checked:
Listing updated:
Michelle Thomas 239-860-7176,
Premier Sotheby's International Realty
Not available
Estimated sales range
Not available
Not available
| Date | Event | Price |
|---|---|---|
| 5/20/2026 | Listed for sale | $498,9000%$261/sqft |
Source: | ||
| 5/8/2026 | Listing removed | $499,000$261/sqft |
Source: | ||
| 4/8/2026 | Price change | $499,000-5%$261/sqft |
Source: | ||
| 1/28/2026 | Price change | $525,000-4.5%$274/sqft |
Source: | ||
| 12/19/2025 | Listed for sale | $550,000+95%$288/sqft |
Source: | ||
| 6/24/2019 | Sold | $282,000-5.2%$147/sqft |
Source: | ||
| 5/23/2019 | Pending sale | $297,500$156/sqft |
Source: Downing Frye Realty Inc. #219034434 Report a problem | ||
| 5/8/2019 | Listed for sale | $297,500-0.5%$156/sqft |
Source: Downing Frye Realty Inc. #219034434 Report a problem | ||
| 10/13/2017 | Listing removed | $299,000$156/sqft |
Source: Premier Sotheby's International Realty #217018892 Report a problem | ||
| 8/3/2017 | Price change | $299,000-9.4%$156/sqft |
Source: Premier Sotheby's International Realty #217018892 Report a problem | ||
| 4/6/2017 | Price change | $329,900-5.7%$172/sqft |
Source: Premier Sotheby's International Realty #217018892 Report a problem | ||
| 3/15/2017 | Listed for sale | $349,900-3.9%$183/sqft |
Source: Premier Sotheby's International Realty #217018892 Report a problem | ||
| 3/15/2004 | Sold | $364,000+2.8%$190/sqft |
Source: | ||
| 4/26/2002 | Sold | $354,000$185/sqft |
Source: Public Record Report a problem | ||
| Year | Property taxes | Tax assessment |
|---|---|---|
| 2025 | $4,349 +4% | $264,064 +2.9% |
| 2024 | $4,180 +93.5% | $256,622 +3% |
| 2023 | $2,161 -2.5% | $249,148 +3% |
| 2022 | $2,215 -0.8% | $241,891 +3% |
| 2021 | $2,233 +2.5% | $234,846 +1.4% |
| 2020 | $2,179 -17.4% | $231,604 |
| 2019 | $2,638 +3.6% | $231,604 +4.2% |
| 2018 | $2,545 -44.8% | $222,243 +10% |
| 2017 | $4,609 -3.2% | $202,039 +8.2% |
| 2016 | $4,763 +8.1% | $186,735 +1.5% |
| 2015 | $4,408 +1.8% | $183,980 |
| 2014 | $4,329 +97.2% | $183,980 |
| 2013 | $2,195 -4.1% | $183,980 -2.9% |
| 2012 | $2,290 -2.9% | $189,522 -3.5% |
| 2011 | $2,360 -32.7% | $196,300 -17% |
| 2010 | $3,506 -12.1% | $236,640 -20% |
| 2009 | $3,988 | $295,800 -18% |
| 2008 | $3,988 -15.2% | $360,732 -10% |
| 2007 | $4,703 -0.1% | $400,814 +6% |
| 2006 | $4,709 | $378,127 +6% |
| 2005 | $4,709 +9.1% | $356,724 +10% |
| 2004 | $4,317 +13.3% | $324,295 +16% |
| 2003 | $3,809 +13.5% | $279,565 +15% |
| 2002 | $3,355 -53.2% | $243,100 -4.7% |
| 2001 | $7,174 +4094.1% | $254,965 |
| 2000 | $171 | -- |
Find assessor info on the county website
A local agent can set up tours, give advice and negotiate with sellers.
A local lender can help you make sure your offer is ready when you are.