$386,400
3 bd|3 ba|1.3k sqft
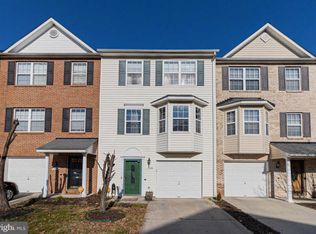
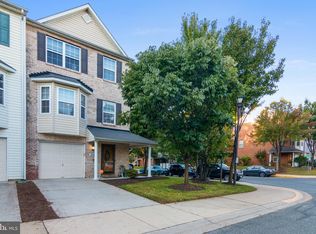
5510 Trout Run Rd, Clinton, MD 20735
Off Market
Likely to sell faster than
Zillow last checked:
Listing updated:
Chris PERRY 301-254-5411,
Compass (202) 386-6330
$389,100
$370,000 - $409,000
$2,763/mo
| Date | Event | Price |
|---|---|---|
| 6/6/2026 | Listed for sale | $389,990+35.9%$290/sqft |
Source: | ||
| 6/3/2026 | Listing removed | $2,795$2/sqft |
Source: Bright MLS #MDPG2187612 Report a problem | ||
| 4/24/2026 | Price change | $2,795-3.5%$2/sqft |
Source: Bright MLS #MDPG2187612 Report a problem | ||
| 1/16/2026 | Listed for rent | $2,895$2/sqft |
Source: Bright MLS #MDPG2187612 Report a problem | ||
| 8/19/2008 | Sold | $286,900+57.3%$213/sqft |
Source: Public Record Report a problem | ||
| 4/21/2003 | Sold | $182,392$136/sqft |
Source: Public Record Report a problem | ||
| Year | Property taxes | Tax assessment |
|---|---|---|
| 2025 | $4,975 +50.7% | $313,800 +5.7% |
| 2024 | $3,302 +6% | $296,967 +6% |
| 2023 | $3,115 +6.4% | $280,133 +6.4% |
| 2022 | $2,928 +5.2% | $263,300 +5.2% |
| 2021 | $2,784 +5.5% | $250,333 +5.5% |
| 2020 | $2,640 -17.6% | $237,367 +10.1% |
| 2019 | $3,203 | $215,533 |
| 2018 | $3,203 +4.3% | $215,533 +4.3% |
| 2017 | $3,071 -11.4% | $206,667 +4.5% |
| 2016 | $3,465 | $197,800 +0.5% |
| 2015 | $3,465 | $196,867 +0.5% |
| 2014 | $3,465 | $195,933 +0.5% |
| 2013 | -- | $195,000 |
| 2012 | -- | $195,000 |
| 2011 | -- | $195,000 -39% |
| 2010 | -- | $319,580 +10.5% |
| 2009 | -- | $289,310 +11.7% |
| 2008 | -- | $259,040 +13.2% |
| 2007 | -- | $228,770 +12.1% |
| 2006 | -- | $204,126 +13.7% |
| 2005 | -- | $179,483 +15.9% |
| 2004 | -- | $154,840 |
| 2003 | -- | $154,840 +1276.4% |
| 2002 | -- | $11,250 |
| 2001 | -- | $11,250 |
Find assessor info on the county website
Source: Bright MLS. This data may not be complete. We recommend contacting the local school district to confirm school assignments for this home.
A local agent can set up tours, give advice and negotiate with sellers.