This very nice 4-bedroom townhouse is back on the market. The price has been dropped substantially and is priced to sell quickly. Very well maintained and ready for the new owners to move on in. Solar Panels were installed approximately two years ago. Cost is only $50/month and Seller says they have decreased the electric bill tremendously. Location is great-close to public transportation, shopping and Washington, DC. .Due to Covid-19 In-person showings are permitted on Saturdays and Sundays only from 2 to 6 pm beginning Saturday, January 30. Must give 24-hour advance notice. Appointments to be made through Showing Time. Masks are required.
Foreclosed
Est. $288,400
5814 Folgate Ct, Capitol Heights, MD 20743
4beds
2baths
1,160sqft
SingleFamily
Built in 1982
1,306 Square Feet Lot
$288,400 Zestimate®
$249/sqft
$166/mo HOA
Overview
- 22 days
- 23
- 0
Facts & features
Interior
Bedrooms & bathrooms
- Bedrooms: 4
- Bathrooms: 2
Heating
- Heat pump
Cooling
- Central
Features
- Has fireplace: Yes
Interior area
- Total interior livable area: 1,160 sqft
Property
Features
- Exterior features: Other
Lot
- Size: 1,306 Square Feet
Details
- Parcel number: 182026532
Construction
Type & style
- Home type: SingleFamily
Materials
- Frame
- Roof: Shake / Shingle
Condition
- Year built: 1982
Community & HOA
HOA
- Has HOA: Yes
- HOA fee: $166 monthly
Location
- Region: Capitol Heights
Financial & listing details
- Price per square foot: $249/sqft
- Tax assessed value: $269,900
- Annual tax amount: $4,498
Foreclosure details
Estimated market value
$288,400
$274,000 - $303,000
$2,713/mo
Price history
| Date | Event | Price |
|---|---|---|
| 9/29/2026 | Sold | $263,000-9.3%$227/sqft |
Source: Public Record Report a problem | ||
| 7/1/2026 | Listing removed | $290,000$250/sqft |
Source:  Bright MLS #MDPG2153872 Report a problem | ||
| 6/16/2026 | Price change | $290,000+9.4%$250/sqft |
Source: Bright MLS #MDPG2153872 Report a problem | ||
| 2/24/2026 | Price change | $265,000-10.2%$228/sqft |
Source: Bright MLS #MDPG2153872 Report a problem | ||
| 8/29/2025 | Price change | $295,000+5.4%$254/sqft |
Source: Bright MLS #MDPG2153872 Report a problem | ||
| 6/24/2025 | Price change | $279,899-3.5%$241/sqft |
Source: Bright MLS #MDPG2153872 Report a problem | ||
| 6/4/2025 | Price change | $290,000+34.9%$250/sqft |
Source: Bright MLS #MDPG2153872 Report a problem | ||
| 5/27/2025 | Listed for sale | $215,000$185/sqft |
Source: Bright MLS #MDPG2153872 Report a problem | ||
| 2/9/2021 | Listing removed | -- |
Source:  Exit Realty Report a problem | ||
| 1/27/2021 | Price change | $215,000-8.5%$185/sqft |
Source: Bright MLS #MDPG570214 Report a problem | ||
| 10/10/2020 | Pending sale | $235,000$203/sqft |
Source: EXIT COMMUNITY REALTY #MDPG570214 Report a problem | ||
| 6/9/2020 | Listed for sale | $235,000+79.4%$203/sqft |
Source: EXIT COMMUNITY REALTY #MDPG570214 Report a problem | ||
| 12/16/2003 | Sold | $131,000+275%$113/sqft |
Source: Public Record Report a problem | ||
| 11/17/1995 | Sold | $34,936$30/sqft |
Source: Public Record Report a problem | ||
Public tax history
| Year | Property taxes | Tax assessment |
|---|---|---|
| 2026 | $4,498 +35.2% | $269,900 +7.4% |
| 2025 | $3,326 +3.5% | $251,233 +8% |
| 2024 | $3,214 +9.5% | $232,567 +8.7% |
| 2023 | $2,935 -0.5% | $213,900 |
| 2022 | $2,949 +13.3% | $213,900 +14.5% |
| 2021 | $2,603 +10.7% | $186,833 +7.8% |
| 2020 | $2,352 +2.8% | $173,300 +12.6% |
| 2019 | $2,287 | $153,900 |
| 2018 | -- | $153,900 +6.7% |
| 2017 | $2,143 -23.6% | $144,200 +5.1% |
| 2016 | $2,806 | $137,167 +5.4% |
| 2015 | $2,806 | $130,133 +5.7% |
| 2014 | $2,806 | $123,100 |
| 2013 | -- | $123,100 |
| 2012 | -- | $123,100 -37.3% |
| 2011 | -- | $196,290 +4.7% |
| 2010 | -- | $187,502 +4.9% |
| 2009 | -- | $178,716 +5.2% |
| 2008 | -- | $169,930 +16.6% |
| 2007 | -- | $145,760 +19.9% |
| 2006 | -- | $121,590 +24.8% |
| 2005 | -- | $97,420 +4.8% |
| 2004 | -- | $92,936 |
| 2003 | -- | $92,936 +10.7% |
| 2002 | -- | $83,970 |
| 2001 | -- | $83,970 |
Find assessor info on the county website
Monthly payment
Climate risks
Neighborhood: 20743
- $310,4004 bd2 ba1.1k sqft5812 Folgate Ct, Capitol Heights, MD 20743Off Market

- $303,3004 bd2 ba1.1k sqft5816 Folgate Ct, Capitol Heights, MD 20743Off Market
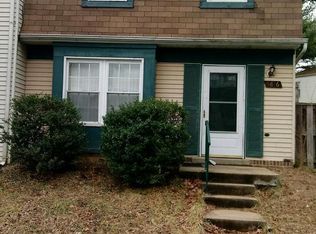
- $299,1004 bd2 ba1.1k sqft5808 Folgate Ct, Capitol Heights, MD 20743Off Market
- $280,0004 bd2 ba1.1k sqft5810 Folgate Ct, Capitol Heights, MD 20743Sold

Similar homes
- $290,0003 bd1 ba882 sqft335 Carmody Hills Dr, Capitol Heights, MD 20743For Sale
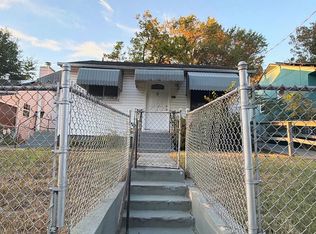
 MLS ID #MDPG2222434, Mr. Sam Odagbodo, Bennett Realty Solutions. Bright MLS
- $349,9005 bd2 ba1k sqft936 Clovis Ave, Capitol Heights, MD 20743For Sale
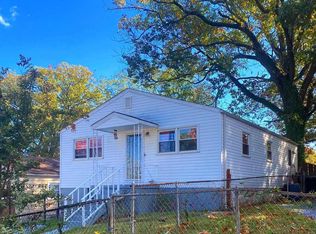 MLS ID #MDPG2222322, Celso Padilla, Samson Properties. Bright MLS
- $329,9903 bd3 ba1.2k sqft1103 Castlehaven Ct, Capitol Heights, MD 20743For Sale
 MLS ID #MDPG2217270, Marquis McCrimmon, Bennett Realty Solutions. Bright MLS
- $330,0003 bd3 ba1.1k sqft332 Shady Glen Dr, Capitol Heights, MD 20743For Sale
 MLS ID #MDPG2223140, Jeffrey Mejia, Spring Hill Real Estate, LLC.. Bright MLS
- $297,5003 bd2 ba1.1k sqft838 Booker Dr, Capitol Heights, MD 20743For SaleMLS ID #MDPG2203976, Isabelle Williams-Brown, Isabelle Williams and Associates LLC. Bright MLS
- $285,0003 bd2 ba864 sqft7103 Fresno St, Capitol Heights, MD 20743For SaleMLS ID #MDPG2197942, Miguel Gotay, Realty Concepts Group LLC. Bright MLS
- $299,9993 bd1 ba864 sqft1304 Doewood Ln, Capitol Heights, MD 20743For SaleMLS ID #MDPG2215674, Jose A Boggio, Dynasty Realty, LLC. Bright MLS
- $349,9004 bd2 ba1.6k sqft707 Mentor Ave, Capitol Heights, MD 20743For SaleMLS ID #MDPG2205120, Maribel Reyes, Samson Properties. Bright MLS
- $310,0002 bd1 ba850 sqft720 Cabin Branch Dr, Capitol Heights, MD 20743For SaleMLS ID #MDPG2222106, Paola Daniela Zorrilla, Spring Hill Real Estate, LLC.. Bright MLS
- $329,9004 bd2 ba1k sqft1422 Fernhill Ct, District Heights, MD 20747For SaleMLS ID #MDPG2210672, Pauline Brisbon, Keller Williams Preferred Properties. Bright MLS
- $322,5253 bd2 ba1.2k sqft6312 Seat Pleasant Dr, Capitol Heights, MD 20743For SaleMLS ID #MDPG2215226, Veronica Henderson, Veronica London Properties. Bright MLS
- $329,9954 bd4 ba1.4k sqft7425 Calder Dr, Capitol Heights, MD 20743For SaleMLS ID #MDPG2214154, BeBe Stokes, Long & Foster Real Estate, Inc.. Bright MLS
- $284,9003 bd2 ba1.1k sqft6714 Hawthorne St, Landover, MD 20785For SaleMLS ID #MDPG2221132, Diego Rodriguez, Spring Hill Real Estate, LLC.. Bright MLS
- $325,0002 bd2 ba1.1k sqft1549 Karen Blvd E, District Heights, MD 20747For SaleMLS ID #MDPG2221844, Bobby Clark, Smart Realty, LLC. Bright MLS
- $310,5002 bd4 ba1.2k sqft8567 Ritchboro Rd, District Heights, MD 20747For SaleMLS ID #MDPG2218640, Joe Bruce, Long & Foster Real Estate, Inc.. Bright MLS
- $400,0003 bd3 ba1.5k sqft6502 Adak St, Capitol Heights, MD 20743For SaleMLS ID #MDPG2204692, Carrie Brown, HomeSmart. Bright MLS
- $387,9004 bd2 ba864 sqft4705 Heath St, Capitol Heights, MD 20743For SaleMLS ID #MDPG2192244, Jacqueline Budgen, EZ Realty, LLC.. Bright MLS
- $325,0003 bd2 ba1k sqft4541 Akron St, Temple Hills, MD 20748For SaleMLS ID #MDPG2221420, Janet Faison, Coldwell Banker Realty. Bright MLS
- $294,9993 bd3 ba1.3k sqft1708 Tulip Ave, District Heights, MD 20747For SaleMLS ID #MDPG2214808, Carlos Zapata, Smart Realty, LLC. Bright MLS
- $275,0002 bd2 ba1.1k sqft913 47th Pl NE, Washington, DC 20019For SaleMLS ID #DCDC2274886, Ray Valentine, Keller Williams Capital Properties. Bright MLS
