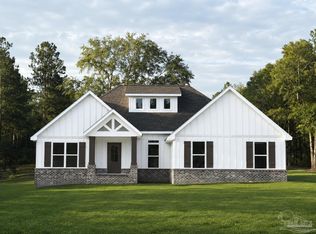
This 3031 square foot single family home has 4 bedrooms and 3.0 bathrooms. This home is located at 6049 Winchester Cir, Milton, FL 32570.
Pre-foreclosure
Street View
Est. $365,354
6049 Winchester Cir, Milton, FL 32570
4beds
3,031sqft
SingleFamily
Built in 2018
0.25 Acres Lot
$-- Zestimate®
$121/sqft
$-- HOA
Overview
- 79 days
- 1,202
- 84
Facts & features
Interior
Bedrooms & bathrooms
- Bedrooms: 4
- Bathrooms: 3
- Full bathrooms: 3
Heating
- Forced air, Heat pump, Electric
Cooling
- Central
Appliances
- Included: Dishwasher, Microwave, Range / Oven, Refrigerator
Features
- Flooring: Tile, Carpet
- Basement: None
- Has fireplace: Yes
Interior area
- Total interior livable area: 3,031 sqft
Property
Parking
- Parking features: Garage - Attached
Features
- Exterior features: Shingle, Brick
Lot
- Size: 0.25 Acres
Details
- Parcel number: 242N29192300C000160
Construction
Type & style
- Home type: SingleFamily
Materials
- Wood
- Foundation: Masonry
- Roof: Shake / Shingle
Condition
- Year built: 2018
Community & HOA
Location
- Region: Milton
Financial & listing details
- Price per square foot: $121/sqft
- Tax assessed value: $365,354
- Annual tax amount: $4,411
Foreclosure details
Estimated market value
Not available
Estimated sales range
Not available
$2,606/mo
Price history
| Date | Event | Price |
|---|---|---|
| 10/7/2026 | Listing removed | $260,000$86/sqft |
Source:  GAMLS #10855811 Report a problem | ||
| 9/30/2026 | Listed for sale | $260,000-40.2%$86/sqft |
Source: GAMLS #10855811 Report a problem | ||
| 4/9/2025 | Listing removed | $434,900$143/sqft |
Source:  PAR #644575 Report a problem | ||
| 3/30/2025 | Price change | $434,900-0.9%$143/sqft |
Source: PAR #644575 Report a problem | ||
| 2/27/2025 | Price change | $439,000-2.4%$145/sqft |
Source: PAR #644575 Report a problem | ||
| 2/13/2025 | Price change | $450,000-1.1%$148/sqft |
Source: PAR #644575 Report a problem | ||
| 9/6/2024 | Price change | $455,000+1.4%$150/sqft |
Source: PAR #644575 Report a problem | ||
| 8/20/2024 | Price change | $448,900-0.2%$148/sqft |
Source: PAR #644575 Report a problem | ||
| 7/18/2024 | Price change | $449,900-3%$148/sqft |
Source: PAR #644575 Report a problem | ||
| 7/8/2024 | Price change | $464,000-1.3%$153/sqft |
Source: PAR #644575 Report a problem | ||
| 7/6/2024 | Price change | $469,900-1.1%$155/sqft |
Source: PAR #644575 Report a problem | ||
| 5/30/2024 | Price change | $474,900-1%$157/sqft |
Source: PAR #644575 Report a problem | ||
| 5/28/2024 | Price change | $479,900-1%$158/sqft |
Source: PAR #644575 Report a problem | ||
| 5/22/2024 | Price change | $484,900-1%$160/sqft |
Source: PAR #644575 Report a problem | ||
| 5/2/2024 | Listed for sale | $489,900+15.3%$162/sqft |
Source: PAR #644575 Report a problem | ||
| 3/29/2023 | Sold | $425,000-3.4%$140/sqft |
Source: PAR #617834 Report a problem | ||
| 2/27/2023 | Pending sale | $440,000$145/sqft |
Source:  ECAOR #908697 Report a problem | ||
| 2/17/2023 | Price change | $440,000-4.3%$145/sqft |
Source: ECAOR #908697 Report a problem | ||
| 11/16/2022 | Price change | $460,000-1.1%$152/sqft |
Source: ECAOR #908697 Report a problem | ||
| 10/17/2022 | Price change | $465,000-2.1%$153/sqft |
Source: ECAOR #908697 Report a problem | ||
| 10/12/2022 | Price change | $475,000-2.1%$157/sqft |
Source: ECAOR #908697 Report a problem | ||
| 9/22/2022 | Listed for sale | $485,000+87.7%$160/sqft |
Source: ECAOR #908697 Report a problem | ||
| 3/23/2018 | Sold | $258,450$85/sqft |
Source: PAR #519643 Report a problem | ||
Public tax history
| Year | Property taxes | Tax assessment |
|---|---|---|
| 2025 | $4,411 +3.1% | $365,354 +1.5% |
| 2024 | $4,278 +0% | $359,824 +1.5% |
| 2023 | $4,276 +65.8% | $354,635 +45.4% |
| 2022 | $2,579 -2.3% | $243,908 +3% |
| 2021 | $2,639 +3.8% | $236,804 +1.4% |
| 2020 | $2,541 +2.2% | $233,535 +2.3% |
| 2019 | $2,486 | $228,284 +1168.2% |
| 2018 | $2,486 +1268.5% | $18,000 +33.3% |
| 2017 | $182 | $13,500 |
| 2016 | $182 +0.2% | $13,500 +15.4% |
| 2015 | $181 +9.2% | $11,700 |
| 2014 | $166 | $11,700 |
Find assessor info on the county website
Monthly payment
Climate risks
Neighborhood: 32570
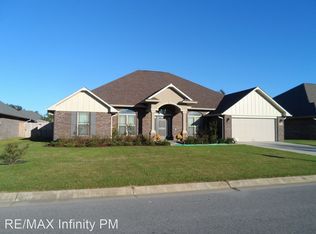
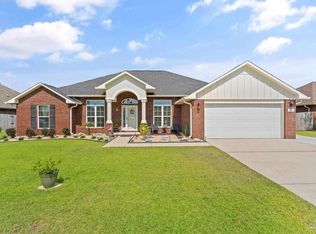

Similar homes
- $359,9993 bd2 ba1.8k sqft6056 Antelope St, Milton, FL 32570For Sale
 MLS ID #688657, Steven Koleno, Beycome of Florida, LLC. PAR
- $405,0004 bd3 ba2.3k sqft5737 Hermitage Cir, Milton, FL 32570For Sale
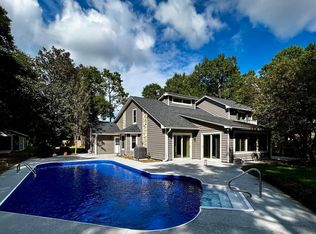 MLS ID #689879, Kimberly Fagan, Levin Rinke Realty. PAR
- $410,0004 bd3 ba3k sqft5589 Colinas Verde Dr, Milton, FL 32570For Sale
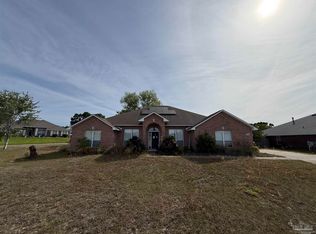 MLS ID #682001, Chandler White, Levin Rinke Realty. PAR
- $458,9003 bd3 ba1.9k sqft9081 Living Good Ln, Milton, FL 32570New Construction
 MLS ID #690026, Jessica Wallace, Patriot Realty. PAR
- $409,9004 bd2 ba2.2k sqft6178 Swainson St, Milton, FL 32570For Sale
 MLS ID #987129, Steve Koleno, Beycome of Florida LLC. Navarre Area BOR
- $358,0005 bd3 ba2.5k sqft5444 Merlin Way, Milton, FL 32583For Sale
 MLS ID #982353, Amber M Carpenter, Endless Horizons Realty Inc. ECAOR
