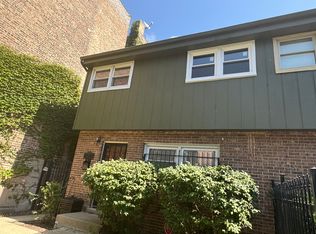
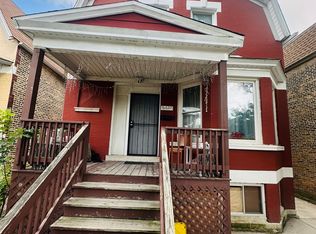
$270,500
5 bd2 ba1.3k sqft
6926 S Rockwell St, Chicago, IL 60629
Off Market
Listing description withheld by the listing agent.
Zillow last checked:
Listing updated:
Shenika Banks 773-787-6143,
Kale Realty

Not available
Estimated sales range
Not available
Not available
| Date | Event | Price |
|---|---|---|
| 10/17/2026 | Listed for sale | $254,900+2%$129/sqft |
Source:  MRED as distributed by MLS GRID #12778976 Report a problem | ||
| 10/3/2026 | Listing removed | $249,900$126/sqft |
Source: eXp Realty #12681433 Report a problem | ||
| 9/7/2026 | Contingent | $249,900$126/sqft |
Source: MRED as distributed by MLS GRID #12681433 Report a problem | ||
| 9/5/2026 | Listed for sale | $249,900$126/sqft |
Source: MRED as distributed by MLS GRID #12681433 Report a problem | ||
| 9/1/2026 | Contingent | $249,900$126/sqft |
Source: MRED as distributed by MLS GRID #12681433 Report a problem | ||
| 8/24/2026 | Price change | $249,900-10.8%$126/sqft |
Source: MRED as distributed by MLS GRID #12681433 Report a problem | ||
| 8/14/2026 | Price change | $280,000-3.4%$141/sqft |
Source: MRED as distributed by MLS GRID #12681433 Report a problem | ||
| 7/24/2026 | Listed for sale | $290,000+81.3%$146/sqft |
Source: MRED as distributed by MLS GRID #12681433 Report a problem | ||
| 6/1/2025 | Listing removed | $160,000$81/sqft |
Source: MRED as distributed by MLS GRID #12203215 Report a problem | ||
| 11/4/2024 | Listed for sale | $160,000-3%$81/sqft |
Source: MRED as distributed by MLS GRID #12203215 Report a problem | ||
| 8/17/2024 | Listing removed | $165,000$83/sqft |
Source: MRED as distributed by MLS GRID #12086999 Report a problem | ||
| 6/18/2024 | Listed for sale | $165,000-2.9%$83/sqft |
Source: MRED as distributed by MLS GRID #12086999 Report a problem | ||
| 2/14/2024 | Listing removed | -- |
Source: MRED as distributed by MLS GRID #11935046 Report a problem | ||
| 11/21/2023 | Listed for sale | $170,000$86/sqft |
Source: MRED as distributed by MLS GRID #11935046 Report a problem | ||
| 10/16/2023 | Listing removed | -- |
Source: MRED as distributed by MLS GRID #11812714 Report a problem | ||
| 6/20/2023 | Listed for sale | $170,000+82.8%$86/sqft |
Source: MRED as distributed by MLS GRID #11812714 Report a problem | ||
| 1/20/2023 | Sold | $93,000+272%$47/sqft |
Source: Public Record Report a problem | ||
| 10/10/2019 | Listing removed | $1,350$1/sqft |
Source: Go Section8 Report a problem | ||
| 9/20/2019 | Listed for rent | $1,350$1/sqft |
Source: Go Section8 Report a problem | ||
| 1/13/2012 | Sold | $25,000-78.3%$13/sqft |
Source: MRED as distributed by MLS GRID #07942715 Report a problem | ||
| 11/29/2011 | Sold | $115,000+477.9%$58/sqft |
Source: Agent Provided Report a problem | ||
| 11/12/2011 | Listed for sale | $19,900-82.7%$10/sqft |
Source: Fannie Mae Report a problem | ||
| 2/21/2007 | Sold | $115,000+30.7%$58/sqft |
Source: MRED as distributed by MLS GRID #06356342 Report a problem | ||
| 12/15/2006 | Sold | $88,000-49.7%$44/sqft |
Source: Public Record Report a problem | ||
| 11/3/2005 | Sold | $175,000+14.4%$88/sqft |
Source: Public Record Report a problem | ||
| 11/12/2004 | Sold | $153,000+80%$77/sqft |
Source: Public Record Report a problem | ||
| 1/10/2002 | Sold | $85,000+139.4%$43/sqft |
Source: Public Record Report a problem | ||
| 3/13/2001 | Sold | $35,500$18/sqft |
Source: Public Record Report a problem | ||
| Year | Property taxes | Tax assessment |
|---|---|---|
| 2024 | $3,229 +153.7% | $16,000 +166.7% |
| 2023 | $1,273 +2.6% | $5,999 |
| 2022 | $1,241 +2.9% | $5,999 |
| 2021 | $1,206 -45.2% | $5,999 -38.9% |
| 2020 | $2,200 -0.2% | $9,811 -10% |
| 2019 | $2,204 +1.7% | $10,902 |
| 2018 | $2,168 -21.6% | $10,902 -9.8% |
| 2017 | $2,764 +7.7% | $12,081 |
| 2016 | $2,567 +9% | $12,081 |
| 2015 | $2,355 +19.7% | $12,081 +21.5% |
| 2014 | $1,968 +1.9% | $9,945 |
| 2013 | $1,932 +1% | $9,945 |
| 2012 | $1,914 -19.8% | $9,945 -26.9% |
| 2011 | $2,385 +0.7% | $13,612 |
| 2010 | $2,368 +3.7% | $13,612 |
| 2009 | $2,284 -8.4% | $13,612 -16.4% |
| 2008 | $2,493 +0.9% | $16,274 |
| 2007 | $2,470 -0.6% | $16,274 |
| 2006 | $2,485 +31.7% | $16,274 +50% |
| 2005 | $1,887 +0.3% | $10,847 |
| 2004 | $1,881 +3.7% | $10,847 |
| 2003 | $1,815 +25% | $10,847 +41.8% |
| 2002 | $1,451 +4.3% | $7,647 |
| 2001 | $1,391 +15.6% | $7,647 |
| 2000 | $1,204 +0.3% | $7,647 +28.9% |
| 1999 | $1,200 | $5,933 |
Source: MRED as distributed by MLS GRID. This data may not be complete. We recommend contacting the local school district to confirm school assignments for this home.
A local agent can set up tours, give advice and negotiate with sellers.
A local lender can help you make sure your offer is ready when you are.