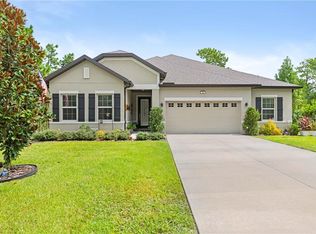
$417,000
3 bd2 ba1.8k sqft
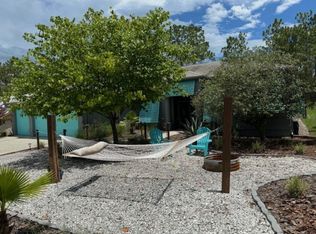
5 Eugenia Ct W, Homosassa, FL 34446
Sold
Zillow last checked:
Listing updated:
PJ Pareja 312-259-7191,
COLDWELL BANKER NEXT GENERATION 352-794-6100
 Originating MLS: Citrus
$380,400
$361,000 - $399,000
$2,267/mo
| Date | Event | Price |
|---|---|---|
| 11/5/2026 | Price change | $387,000-0.3%$202/sqft |
Source:  Stellar MLS #CC853700 Report a problem | ||
| 11/3/2026 | Listed for sale | $388,000$202/sqft |
Source: Stellar MLS #CC853700 Report a problem | ||
| 10/14/2026 | Listing removed | $388,000$202/sqft |
Source: Stellar MLS #CC853700 Report a problem | ||
| 8/10/2026 | Price change | $388,000-0.3%$202/sqft |
Source:  Realtors Association of Citrus County #853700 Report a problem | ||
| 5/4/2026 | Price change | $389,000-2.5%$203/sqft |
Source: Realtors Association of Citrus County #853700 Report a problem | ||
| 4/3/2026 | Listed for sale | $399,000$208/sqft |
Source: Realtors Association of Citrus County #853700 Report a problem | ||
| 4/2/2026 | Listing removed | $399,000$208/sqft |
Source: Stellar MLS #O6367326 Report a problem | ||
| 1/29/2026 | Price change | $399,000-4.8%$208/sqft |
Source: Stellar MLS #O6367326 Report a problem | ||
| 12/18/2025 | Listed for sale | $419,000+1%$218/sqft |
Source: Stellar MLS #O6367326 Report a problem | ||
| 11/18/2025 | Listing removed | $415,000$216/sqft |
Source: Stellar MLS #O6310816 Report a problem | ||
| 5/21/2025 | Price change | $415,000-3.5%$216/sqft |
Source: Stellar MLS #O6310816 Report a problem | ||
| 4/23/2025 | Listed for sale | $430,000+1586.3%$224/sqft |
Source: Owner Report a problem | ||
| 8/27/2021 | Sold | $25,500-5.6%$13/sqft |
Source: Public Record Report a problem | ||
| 7/14/2021 | Pending sale | $27,000$14/sqft |
Source: Realtors Association of Citrus County #802803 Report a problem | ||
| 6/23/2021 | Listed for sale | $27,000-89.4%$14/sqft |
Source: Realtors Association of Citrus County #802803 Report a problem | ||
| 6/2/2012 | Listing removed | $254,900$133/sqft |
Source: ERA Key I Realty, Inc. #353057 Report a problem | ||
| 4/21/2012 | Price change | $254,900-5.2%$133/sqft |
Source: ERA Key I Realty, Inc. #353057 Report a problem | ||
| 1/10/2012 | Listed for sale | $268,800+826.9%$140/sqft |
Source: ERA Key I Realty, Inc. #353057 Report a problem | ||
| 2/18/2005 | Sold | $29,000+38.1%$15/sqft |
Source: Public Record Report a problem | ||
| 5/12/2004 | Sold | $21,000$11/sqft |
Source: Public Record Report a problem | ||
| Year | Property taxes | Tax assessment |
|---|---|---|
| 2025 | $2,193 +5.4% | $172,745 +2.9% |
| 2024 | $2,082 +621.9% | $167,877 +990.1% |
| 2023 | $288 +1.9% | $15,400 +10% |
| 2022 | $283 +44.8% | $14,000 +81.8% |
| 2021 | $195 +7% | $7,700 +10% |
| 2020 | $183 -13.5% | $7,000 -13.2% |
| 2019 | $211 +45.2% | $8,063 +10% |
| 2018 | $145 | $7,330 -14.3% |
| 2017 | $145 -14.1% | $8,550 |
| 2016 | $169 -3% | $8,550 -25.6% |
| 2015 | $175 -14% | $11,490 +46.9% |
| 2014 | $203 +11.9% | $7,820 -3.2% |
| 2013 | $181 -1.9% | $8,075 -11.2% |
| 2012 | $185 -0.5% | $9,095 -0.3% |
| 2011 | $186 -10% | $9,120 -14.4% |
| 2010 | $206 -25.8% | $10,660 -30.9% |
| 2009 | $278 +0.6% | $15,416 |
| 2008 | $277 -57.8% | $15,416 -61.5% |
| 2007 | $655 -13.1% | $40,000 -10.7% |
| 2006 | $754 +92.9% | $44,800 +119.6% |
| 2005 | $391 +96.3% | $20,400 +119.4% |
| 2004 | $199 +11.2% | $9,300 +9.4% |
| 2003 | $179 +1.7% | $8,500 +3.7% |
| 2002 | $176 +27.8% | $8,200 +24.2% |
| 2000 | $138 | $6,600 |
Source: Stellar MLS. This data may not be complete. We recommend contacting the local school district to confirm school assignments for this home.

A local agent can set up tours, give advice and negotiate with sellers.