$283,700
3 bd|2 ba|1.7k sqft
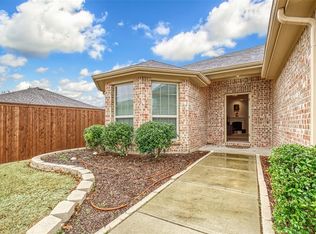
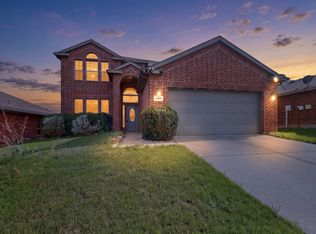
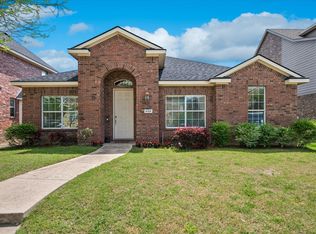
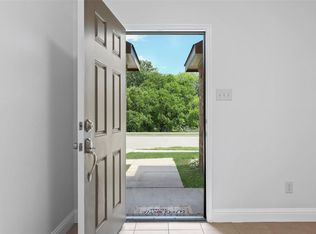
708 Harrison Ln, Lavon, TX 75166
Off Market
Likely to sell faster than
Zillow last checked:
Listing updated:
Kim Bentley 0603465 214-796-0266,
Coldwell Banker Apex, REALTORS 972-772-9300
Not available
Estimated sales range
Not available
Not available
| Date | Event | Price |
|---|---|---|
| 6/23/2026 | Listed for sale | $294,500-1.8%$150/sqft |
Source: NTREIS #21310765 Report a problem | ||
| 6/12/2026 | Sold | -- |
Source: Public Record Report a problem | ||
| 2/22/2026 | Price change | $299,900-4.8%$152/sqft |
Source: NTREIS #21103631 Report a problem | ||
| 12/1/2025 | Price change | $314,999-3.1%$160/sqft |
Source: NTREIS #21103631 Report a problem | ||
| 11/4/2025 | Listed for sale | $325,000+1.9%$165/sqft |
Source: NTREIS #21103631 Report a problem | ||
| 10/11/2024 | Sold | -- |
Source: NTREIS #20510494 Report a problem | ||
| 9/23/2024 | Listing removed | $319,000$162/sqft |
Source: NTREIS #20510494 Report a problem | ||
| 9/20/2024 | Contingent | $319,000$162/sqft |
Source: NTREIS #20510494 Report a problem | ||
| 8/5/2024 | Price change | $319,000-3.3%$162/sqft |
Source: NTREIS #20510494 Report a problem | ||
| 6/30/2024 | Price change | $329,880-2.3%$168/sqft |
Source: NTREIS #20510494 Report a problem | ||
| 6/12/2024 | Price change | $337,750-0.2%$172/sqft |
Source: NTREIS #20510494 Report a problem | ||
| 5/25/2024 | Price change | $338,500-1%$172/sqft |
Source: NTREIS #20510494 Report a problem | ||
| 5/7/2024 | Price change | $342,000-0.9%$174/sqft |
Source: NTREIS #20510494 Report a problem | ||
| 4/27/2024 | Price change | $345,000-1.3%$175/sqft |
Source: NTREIS #20510494 Report a problem | ||
| 3/20/2024 | Price change | $349,490-0.1%$177/sqft |
Source: NTREIS #20510494 Report a problem | ||
| 2/5/2024 | Listed for sale | $349,990$178/sqft |
Source: NTREIS #20510494 Report a problem | ||
| Year | Property taxes | Tax assessment |
|---|---|---|
| 2025 | $4,615 | $316,357 -3.8% |
| 2024 | -- | $328,994 +10% |
| 2023 | $1,549 -53.4% | $299,085 +10% |
| 2022 | $3,323 +0.4% | $271,895 +10% |
| 2021 | $3,308 -4.3% | $247,177 +4.9% |
| 2020 | $3,458 +24.2% | $235,742 -0.8% |
| 2019 | $2,783 | $237,603 +10% |
| 2018 | $2,783 | $216,003 +9% |
| 2017 | $2,783 | $198,125 +4.5% |
| 2016 | $2,783 -5.5% | $189,614 +15.1% |
| 2015 | $2,946 | $164,770 +2.8% |
| 2014 | $2,946 | $160,312 +8.8% |
| 2013 | -- | $147,382 +480% |
| 2012 | -- | $25,410 +3.1% |
| 2011 | -- | $24,640 +27.6% |
| 2010 | -- | $19,305 |
| 2009 | -- | $19,305 |
Find assessor info on the county website
Source: NTREIS. This data may not be complete. We recommend contacting the local school district to confirm school assignments for this home.
A local agent can set up tours, give advice and negotiate with sellers.