LOCATION LOCATION LOCATION! A family owned 4 units for the past 100 years. Brick underneath the siding. Needs major rehab/tear down and building could go up 1-2 levels. 2 of the units are being lived in right now. A rehabber, contractor or builder's dream an Definity will be a huge many maker location! PLEASE CALL AGENT FOR SHOWINGS
Active
$495,000
719 S Aberdeen St, Chicago, IL 60607
4beds
--sqft
Multi Family
Built in 1888
-- sqft lot
$489,800 Zestimate®
$--/sqft
$-- HOA
What's special
Brick underneath the siding
- 7 days
- 607
- 38
Zillow last checked:
Listing updated:
Listed by:
Donna Anello-Surma 312-927-1434,
New West Realty Partners LLC
Source: MRED as distributed by MLS GRID,MLS#: 12704260
Facts & features
Interior
Bedrooms & bathrooms
- Bedrooms: 4
- Bathrooms: 3
- Full bathrooms: 3
Heating
- Natural Gas, Forced Air
Features
- Basement: Crawl Space
Property
Parking
- Total spaces: 4
- Parking features: Yes
Lot
- Size: 2,600 Square Feet
- Dimensions: 26x100
Details
- Parcel number: 17174110100000
- Special conditions: List Broker Must Accompany
Construction
Type & style
- Home type: MultiFamily
- Property subtype: Multi Family
Materials
- Vinyl Siding, Brick
Condition
- New construction: No
- Year built: 1888
Utilities & green energy
- Sewer: Public Sewer
- Water: Lake Michigan, Public
Community & HOA
Location
- Region: Chicago
Financial & listing details
- Tax assessed value: $660,000
- Annual tax amount: $12,001
- Date on market: 10/13/2026
- Ownership: Fee Simple
Estimated market value
$489,800
$465,000 - $514,000
$4,082/mo
Price history
| Date | Event | Price |
|---|---|---|
| 10/13/2026 | Listed for sale | $495,000+266.7% |
Source:  MRED as distributed by MLS GRID #12704260 Report a problem | ||
| 6/4/1999 | Sold | $135,000 |
Source: Public Record Report a problem | ||
Public tax history
| Year | Property taxes | Tax assessment |
|---|---|---|
| 2024 | $12,645 +5.4% | $66,000 +10% |
| 2023 | $12,001 +2.8% | $60,000 |
| 2022 | $11,677 +2.1% | $60,000 |
| 2021 | $11,433 +21.5% | $60,000 +32.7% |
| 2020 | $9,409 -1.4% | $45,199 -11% |
| 2019 | $9,546 +1.7% | $50,786 |
| 2018 | $9,384 +14% | $50,786 +22.4% |
| 2017 | $8,232 +5.4% | $41,486 |
| 2016 | $7,809 +9.7% | $41,486 |
| 2015 | $7,121 +11.6% | $41,486 +12.3% |
| 2014 | $6,380 +2.2% | $36,957 |
| 2013 | $6,243 +1% | $36,957 |
| 2012 | $6,184 -19.1% | $36,957 -27.8% |
| 2011 | $7,641 +1.3% | $51,191 |
| 2010 | $7,541 +6.9% | $51,191 |
| 2009 | $7,057 +27.4% | $51,191 +12.9% |
| 2008 | $5,541 +1% | $45,340 -5.1% |
| 2007 | $5,484 +15.8% | $47,753 |
| 2006 | $4,734 +21.7% | $47,753 +53.4% |
| 2005 | $3,891 +2.9% | $31,131 |
| 2004 | $3,780 +3.8% | $31,131 |
| 2003 | $3,640 +20.9% | $31,131 +85.7% |
| 2002 | $3,012 +27.7% | $16,762 |
| 2001 | $2,357 -14% | $16,762 |
| 2000 | $2,742 +128.7% | $16,762 -3.6% |
| 1999 | $1,199 | $17,383 |
Find assessor info on the county website
Monthly payment
Est. payment
Payment breakdown
Explore the cost of this home by adjusting the details. Changes won't be saved.Climate risks
Neighborhood: University Village - Little Italy
Nearby schools


Similar homes
- $495,0005 bd2 ba2.5k sqft812 S Miller St APT G, Chicago, IL 60607Active
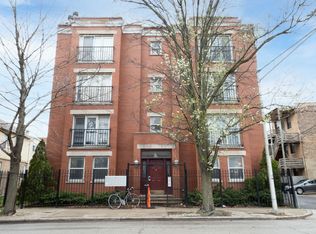 MLS ID #12785547, Mehdi Mova, Compass. MRED as distributed by MLS GRID
- $550,0002 bd2 ba1.7k sqft400 S Green St APT 210, Chicago, IL 60607New
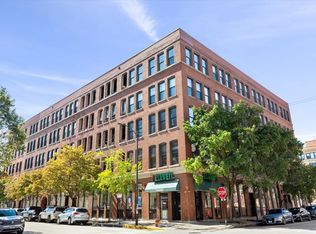 MLS ID #12735328, Luke Blahnik, @properties Christie's International Real Estate. MRED as distributed by MLS GRID
- $375,0003 bd2 ba1.3k sqft812 S Miller St #3S, Chicago, IL 60607New
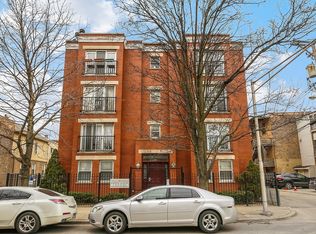 MLS ID #12786380, Jacqueline Alter, Redfin Corporation. MRED as distributed by MLS GRID
- $375,0003 bd2 ba1.3k sqft812 S Miller St #3N, Chicago, IL 60607NewMLS ID #12786431, Jacqueline Alter, Redfin Corporation. MRED as distributed by MLS GRID
