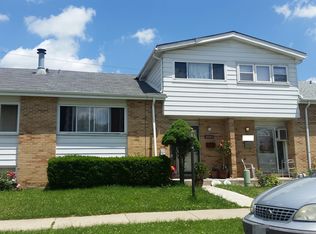
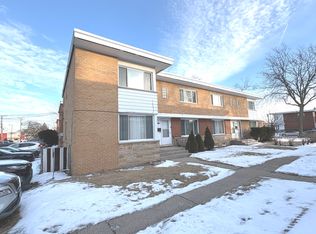
Fully updated, spacious end unit, 3 bedroom and 2 full bath, great location, close to everything, walk to schools, shopping, restaurants and parks.
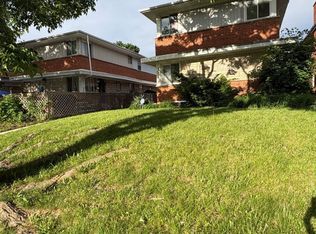
Large open kitchen, new appliances, hardwood flooring, laundry and storage. Fully fenced back yard. Basement and plenty of storage.
For sale by owner
$355,000
8052 W Lyons St, Niles, IL 60714
3beds
1,210sqft
Townhouse
Built in 1963
3,186 Square Feet Lot
$363,500 Zestimate®
$293/sqft
$-- HOA
What's special
Large open kitchenLaundry and storageHardwood flooringPlenty of storageNew appliances
- 68 days |
- 1,048 |
- 25 |
Listed by:
Property Owner (847) 736-9080
Facts & features
Interior
Bedrooms & bathrooms
- Bedrooms: 3
- Bathrooms: 2
- Full bathrooms: 1
Heating
- Forced air, Gas
Cooling
- Other
Appliances
- Included: Dishwasher, Dryer, Washer
- Laundry: In Unit
Features
- Flooring: Hardwood
- Basement: Finished
Interior area
- Total interior livable area: 1,210 sqft
Property
Parking
- Total spaces: 1
- Parking features: Off-street
Features
- Exterior features: Vinyl, Brick
Lot
- Size: 3,186 Square Feet
Details
- Parcel number: 0914206094
Construction
Type & style
- Home type: Townhouse
Materials
- Frame
- Roof: Asphalt
Condition
- New construction: No
- Year built: 1963
Community & HOA
Location
- Region: Niles
Financial & listing details
- Price per square foot: $293/sqft
- Tax assessed value: $230,000
- Date on market: 4/26/2026
Estimated market value
$363,500
$331,000 - $400,000
$2,724/mo
Price history
| Date | Event | Price |
|---|---|---|
| 6/16/2026 | Sold | $363,000+2.3%$300/sqft |
Source: | ||
| 5/9/2026 | Contingent | $354,900$293/sqft |
Source: | ||
| 4/30/2026 | Price change | $354,9000%$293/sqft |
Source: | ||
| 4/26/2026 | Listed for sale | $355,000+24.6%$293/sqft |
Source: Owner Report a problem | ||
| 5/9/2025 | Listing removed | $2,500$2/sqft |
Source: Zillow Rentals Report a problem | ||
| 4/26/2025 | Listed for rent | $2,500+4.2%$2/sqft |
Source: Zillow Rentals Report a problem | ||
| 6/3/2024 | Listing removed | -- |
Source: Zillow Rentals Report a problem | ||
| 5/8/2024 | Listed for rent | $2,400+50%$2/sqft |
Source: Zillow Rentals Report a problem | ||
| 6/5/2021 | Listing removed | -- |
Source: Owner Report a problem | ||
| 3/8/2021 | Listed for sale | $285,000+124.4%$236/sqft |
Source: Owner Report a problem | ||
| 6/29/2019 | Listing removed | $1,600$1/sqft |
Source: Worth Clark Realty #10414849 Report a problem | ||
| 6/13/2019 | Listed for rent | $1,600$1/sqft |
Source: Worth Clark Realty #10414849 Report a problem | ||
| 8/4/1994 | Sold | $127,000$105/sqft |
Source: Public Record Report a problem | ||
Public tax history
| Year | Property taxes | Tax assessment |
|---|---|---|
| 2024 | -- | $23,000 0% |
| 2023 | $5,926 +6.5% | $23,001 |
| 2022 | $5,566 +38.7% | $23,001 +66.4% |
| 2021 | $4,012 +5.7% | $13,825 |
| 2020 | $3,794 -10% | $13,825 -21% |
| 2019 | $4,217 +6.1% | $17,500 +17.4% |
| 2018 | $3,974 +1% | $14,900 |
| 2017 | $3,935 -12.8% | $14,900 -18.6% |
| 2016 | $4,512 +8% | $18,310 +17.8% |
| 2015 | $4,179 +3.7% | $15,537 |
| 2014 | $4,032 +1.8% | $15,537 |
| 2013 | $3,959 -9% | $15,537 -20.5% |
| 2012 | $4,351 +4.7% | $19,538 |
| 2011 | $4,157 +1.3% | $19,538 |
| 2010 | $4,102 -8.2% | $19,538 -14.5% |
| 2009 | $4,467 +25.6% | $22,854 -12% |
| 2008 | $3,557 +1.8% | $25,971 |
| 2007 | $3,494 +18.1% | $25,971 +27.6% |
| 2006 | $2,959 +0.7% | $20,347 |
| 2005 | $2,939 -16.8% | $20,347 |
| 2004 | $3,531 +24.5% | $20,347 +14.7% |
| 2003 | $2,836 -0.2% | $17,734 |
| 2002 | $2,843 +4.8% | $17,734 |
| 2001 | $2,714 +1.1% | $17,734 +21.8% |
| 2000 | $2,684 | $14,558 |
| 1999 | $2,684 | $14,558 |
Find assessor info on the county website
Monthly payment
Est. payment$--/mo
Payment breakdown
Explore the cost of this home by adjusting the details. Changes won't be saved.All calculations are estimates and provided by Zillow, Inc. for informational purposes only. Actual amounts may vary.
HOA fees may include property taxes on listings classified as Co-Ops. Contact the listing agent and/or owner for fee details.
Mortgage interest rates are dependent on a number of factors, including credit score, down payment, and repayment length. Interest rate data provided by Zillow Group Marketplace, Inc. as of 1/1/1970 from various mortgage lenders with which we have lead or other similar arrangements; the Estimated Payment is an average of those rates.
See how much you could borrow to make a competitive offer.
Climate risks
Neighborhood: Courtland Park
Nearby schools
GreatSchools rating
- 6/10Washington Elementary SchoolGrades: K-5Distance: 0.4 mi
- 7/10Gemini Middle SchoolGrades: 6-8Distance: 0.8 mi
- 10/10Maine East High SchoolGrades: 9-12Distance: 1.8 mi

A local agent can set up tours, give advice and negotiate with sellers.


- Illinois
- Cook County
- Niles
- 60714
- Courtland Park
- 8052 W Lyons St
Nearby cities
Nearby neighborhoods
Nearby zip codes
Other Niles Topics
