This 1674 square foot single family home has 3 bedrooms and 3.0 bathrooms. This home is located at 918 Bedford Rd, Las Vegas, NV 89107.
Pre-foreclosure
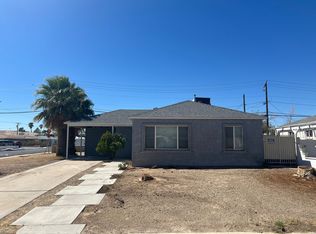
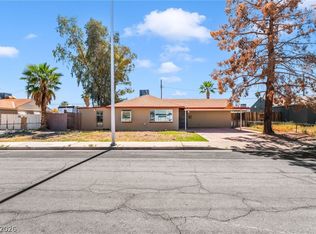
Street View
Est. $385,200
918 Bedford Rd, Las Vegas, NV 89107
3beds
3baths
1,674sqft
SingleFamily
Built in 1953
7,405 Square Feet Lot
$385,200 Zestimate®
$230/sqft
$-- HOA
Overview
- 192 days |
- 19 |
- 0 |
Facts & features
Interior
Bedrooms & bathrooms
- Bedrooms: 3
- Bathrooms: 3
Heating
- Forced air
Cooling
- Central
Features
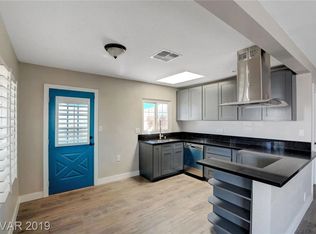
- Flooring: Carpet, Concrete, Linoleum / Vinyl
- Has fireplace: Yes
Interior area
- Total interior livable area: 1,674 sqft
Property
Features
- Exterior features: Cement / Concrete
Lot
- Size: 7,405 Square Feet
Details
- Parcel number: 13931411056
Construction
Type & style
- Home type: SingleFamily
Materials
- masonry
- Roof: Composition
Condition
- Year built: 1953
Community & HOA
Location
- Region: Las Vegas
Financial & listing details
- Price per square foot: $230/sqft
- Tax assessed value: $163,894
- Annual tax amount: $3,554
Visit our professional directory to find a foreclosure specialist in your area that can help with your home search.
Find a foreclosure agentForeclosure details
Estimated market value
$385,200
$347,000 - $416,000
$2,573/mo
Price history
| Date | Event | Price |
|---|---|---|
| 3/28/1997 | Sold | $97,000$58/sqft |
Source: Public Record Report a problem | ||
Public tax history
| Year | Property taxes | Tax assessment |
|---|---|---|
| 2025 | $3,554 -0.8% | $57,363 +5.9% |
| 2024 | $3,581 +78.9% | $54,160 +15.6% |
| 2023 | $2,002 +113.5% | $46,862 +12.8% |
| 2022 | $938 +7.8% | $41,558 +1.4% |
| 2021 | $870 -49% | $40,985 +13.4% |
| 2020 | $1,705 +119.2% | $36,135 +13.4% |
| 2019 | $778 -54.4% | $31,865 |
| 2018 | $1,706 | $31,865 +7.5% |
| 2017 | $1,706 | $29,633 +16.1% |
| 2016 | $1,706 +108.8% | $25,531 +3.4% |
| 2015 | $817 -69.6% | $24,687 +18.5% |
| 2014 | $2,692 | $20,830 |
| 2013 | -- | $20,830 +2.1% |
| 2012 | -- | $20,400 -3.5% |
| 2011 | -- | $21,142 -1.9% |
| 2010 | -- | $21,541 -24.6% |
| 2009 | -- | $28,574 |
| 2008 | -- | $28,574 -39.5% |
| 2007 | -- | $47,249 +26.3% |
| 2006 | -- | $37,398 +31.8% |
| 2005 | -- | $28,371 +18.8% |
| 2004 | -- | $23,877 +3.2% |
| 2003 | -- | $23,135 -1.5% |
| 2002 | -- | $23,480 +7.8% |
| 2001 | -- | $21,780 |
Find assessor info on the county website
Monthly payment
Estimated monthly payment$1,822
All calculations are estimates and provided by Zillow, Inc. for informational purposes only. Actual amounts may vary.
HOA fees may include property taxes on listings classified as Co-Ops. Contact the listing agent and/or owner for fee details.
Mortgage interest rates are dependent on a number of factors, including credit score, down payment, and repayment length. Interest rate data provided by Zillow Group Marketplace, Inc. as of 1/1/1970 from various mortgage lenders with which we have lead or other similar arrangements; the Estimated Payment is an average of those rates.
See how much you could borrow to make a competitive offer.
Climate risks
Neighborhood: Rancho Charleston
Nearby schools
GreatSchools rating
- 5/10E W Griffith Elementary SchoolGrades: PK-5Distance: 0.6 mi
- 6/10Hyde Park Middle SchoolGrades: 6-8Distance: 0.2 mi
- 1/10Western High SchoolGrades: 9-12Distance: 1.1 mi


- Nevada
- Clark County
- Las Vegas
- 89107
- Rancho Charleston
- 918 Bedford Rd
Nearby cities
Nearby neighborhoods
Nearby zip codes
Other Las Vegas Topics
