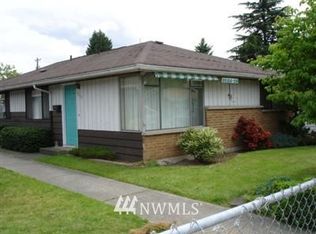
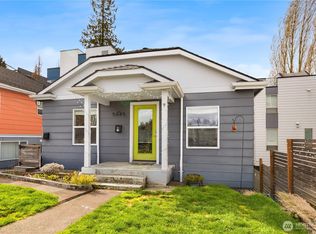
Excellent investment opportunity in South Delridge! This turn-key duplex features stable, income-generating tenants in place for both units. Please do not disturb occupants. Both units are well-maintained, feature great layouts, and sit in a highly walkable location just blocks from local transit and dining. Ideal for a savvy investor looking for immediate cash flow in Seattle.
Active
Listed by: Upper Left Property Management • Molly D. Hodges • 206-501-1899
$825,000
9202 17th Avenue SW, Seattle, WA 98106
4beds
2baths
1,920sqft
Duplex, Multi Family
Built in 1939
-- sqft lot
$804,200 Zestimate®
$430/sqft
$-- HOA
What's special
Great layouts
- --
- on Zillow
- 103
- views
- 4
- saves
Zillow last checked:
Listing updated:
Listed by:
Molly D. Hodges 206-501-1899 molly@upperleftmanagement.com,
Upper Left Property Management
Source: NWMLS as distributed by MLS GRID,MLS#: 2579196
Facts & features
Interior
Bedrooms & bathrooms
- Bedrooms: 4
- Bathrooms: 2
Heating
- Fireplace Insert, Forced Air, Electric, Oil
Cooling
- None
Features
- Flooring: Hardwood, Laminate, Stone, Carpet
- Has fireplace: No
Interior area
- Total structure area: 1,920
- Total interior livable area: 1,920 sqft
Property
Lot
- Size: 3,397 Square Feet
- Features: Corner Lot, Curbs, Paved, Sidewalk, Cable TV, Deck, Fenced-Fully, Gas Available
Details
- Parcel number: 9352900165
- Zoning description: Residential,Jurisdiction: City
- Special conditions: Standard
Construction
Type & style
- Home type: MultiFamily
- Architectural style: Duplex
- Property subtype: Duplex, Multi Family
Materials
- Cement Planked, Cement Plank
- Foundation: Slab
- Roof: Composition
Condition
- Year built: 1939
Utilities & green energy
- Sewer: Sewer Connected
- Water: Public
Community & HOA
Community
- Subdivision: White Center
Location
- Region: Seattle
Financial & listing details
- Price per square foot: $430/sqft
- Tax assessed value: $749,000
- Annual tax amount: $7,421
- Date on market: 9/8/2026
- Listing terms: Conventional
Estimated market value
$804,200
$764,000 - $844,000
$2,333/mo
Price history
| Date | Event | Price |
|---|---|---|
| 9/8/2026 | Listed for sale | $825,000+33.3%$430/sqft |
Source:  NWMLS as distributed by MLS GRID #2579196 Report a problem | ||
| 3/24/2021 | Listing removed | -- |
Source: Owner Report a problem | ||
| 2/23/2018 | Listing removed | $618,888$322/sqft |
Source: Owner Report a problem | ||
| 2/10/2018 | Listed for sale | $618,888+129.2%$322/sqft |
Source: Owner Report a problem | ||
| 3/11/2008 | Sold | $270,000-15%$141/sqft |
Source: NWMLS as distributed by MLS GRID #27186692 Report a problem | ||
| 5/11/2005 | Sold | $317,500+41.1%$165/sqft |
Source: NWMLS as distributed by MLS GRID #25031170 Report a problem | ||
| 7/2/2003 | Sold | $225,000+22.1%$117/sqft |
Source: NWMLS as distributed by MLS GRID #23004671 Report a problem | ||
| 4/30/2001 | Sold | $184,300$96/sqft |
Source: NWMLS as distributed by MLS GRID #21030088 Report a problem | ||
Public tax history
| Year | Property taxes | Tax assessment |
|---|---|---|
| 2025 | $7,912 +7.1% | $749,000 -0.5% |
| 2024 | $7,390 +15.6% | $753,000 +16.6% |
| 2023 | $6,392 +3.9% | $646,000 -7.1% |
| 2022 | $6,155 +17.8% | $695,000 +29.4% |
| 2021 | $5,225 +5.5% | $537,000 +11.4% |
| 2020 | $4,950 +2% | $482,000 +0.6% |
| 2019 | $4,852 +10.5% | $479,000 -0.6% |
| 2018 | $4,392 +5.9% | $482,000 +22% |
| 2017 | $4,146 +69.8% | $395,000 +15.8% |
| 2016 | $2,441 | $341,000 +25.8% |
| 2015 | $2,441 | $271,000 +15.8% |
| 2014 | $2,441 | $234,000 +18.8% |
| 2013 | $2,441 | $197,000 -2% |
| 2012 | -- | $201,000 -13% |
| 2011 | -- | $231,000 -1.7% |
| 2010 | -- | $235,000 |
| 2009 | -- | $235,000 +4.4% |
| 2007 | -- | $225,000 +22.3% |
| 2006 | -- | $184,000 |
| 2005 | -- | $184,000 +12.2% |
| 2001 | $465 +2.9% | $164,000 +51.3% |
| 2000 | $452 | $108,400 |
Find assessor info on the county website
Monthly payment
Est. payment
Payment breakdown
Explore the cost of this home by adjusting the details. Changes won't be saved.Climate risks
Neighborhood: South Delridge

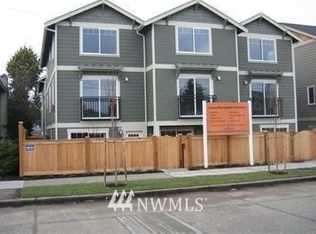

Similar homes
- $799,0004 bd2 ba2k sqft5060 Renton Avenue S, Seattle, WA 98118Active
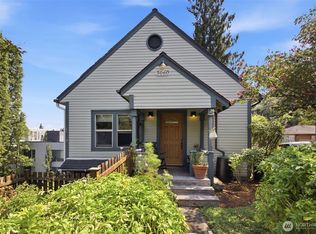 MLS ID #2574244, Mustapha Math. NWMLS as distributed by MLS GRID
- $735,0003 bd2 ba1.9k sqft6657 Ellis Avenue S, Seattle, WA 98108Active
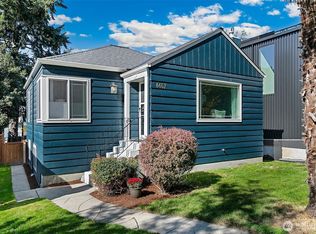 MLS ID #2586682, Tracy Hepler. NWMLS as distributed by MLS GRID
- $779,9504 bd3 ba2k sqft1923 15th Avenue S, Seattle, WA 98144Active
 MLS ID #2582649, Julie K Clark. NWMLS as distributed by MLS GRID
- $800,0005 bd2 ba1.9k sqft5045 37th Avenue S, Seattle, WA 98118Active
 MLS ID #2493055, Peng Tea. NWMLS as distributed by MLS GRID
