This 1544 square foot single family home has 5 bedrooms and 2.5 bathrooms. This home is located at 9979 S Blossom Dr, Sandy, UT 84092.
Pre-foreclosure
Street View
Est. $669,500
9979 S Blossom Dr, Sandy, UT 84092
5beds
2baths
1,544sqft
SingleFamily
Built in 1977
0.27 Acres Lot
$669,500 Zestimate®
$434/sqft
$-- HOA
Overview
- 100 days
- 7
- 2
Facts & features
Interior
Bedrooms & bathrooms
- Bedrooms: 5
- Bathrooms: 2.5
Heating
- Other
Cooling
- Central
Features
- Basement: Finished
- Has fireplace: Yes
Interior area
- Total interior livable area: 1,544 sqft
Property
Parking
- Parking features: Garage - Attached
Features
- Exterior features: Brick
Lot
- Size: 0.27 Acres
Details
- Parcel number: 28093510030000
Construction
Type & style
- Home type: SingleFamily
Materials
- brick
- Roof: Asphalt
Condition
- Year built: 1977
Community & HOA
Location
- Region: Sandy
Financial & listing details
- Price per square foot: $434/sqft
- Tax assessed value: $656,600
- Annual tax amount: $3,366
Foreclosure details
Estimated market value
$669,500
$623,000 - $716,000
$2,488/mo
Price history
| Date | Event | Price |
|---|---|---|
| 6/29/2004 | Sold | -- |
Source: Agent Provided Report a problem | ||
Public tax history
| Year | Property taxes | Tax assessment |
|---|---|---|
| 2025 | $3,366 +0.9% | $361,130 +1.2% |
| 2024 | $3,335 +7.5% | $356,675 +9.2% |
| 2023 | $3,103 -2.6% | $326,645 -1% |
| 2022 | $3,185 +4.3% | $329,835 +22.3% |
| 2021 | $3,055 +16.5% | $269,665 +23.4% |
| 2020 | $2,621 +1.8% | $218,460 +4.3% |
| 2019 | $2,576 +4.5% | $209,550 +4.2% |
| 2018 | $2,465 +15.4% | $201,190 -37.8% |
| 2017 | $2,135 -2% | $323,500 +8.2% |
| 2016 | $2,180 +4.7% | $299,000 +5.1% |
| 2015 | $2,081 -2.5% | $284,400 +8% |
| 2014 | $2,135 | $263,400 +4.1% |
| 2013 | -- | $253,100 +3.4% |
| 2012 | -- | $244,800 -3% |
| 2011 | -- | $252,300 -6.9% |
| 2010 | -- | $270,900 -1.3% |
| 2009 | -- | $274,600 -13.2% |
| 2008 | $1,818 | $316,200 +8.8% |
| 2007 | -- | $290,500 +27% |
| 2006 | -- | $228,800 +11.3% |
| 2005 | -- | $205,500 +20.2% |
| 2002 | -- | $171,000 +6.9% |
| 2001 | -- | $160,000 +0.1% |
| 2000 | -- | $159,800 |
Find assessor info on the county website
Monthly payment
Climate risks
Neighborhood: 84092


Similar homes
- $650,0004 bd3 ba2.2k sqft10313 S Countrywood Dr E, Sandy, UT 84092For Sale
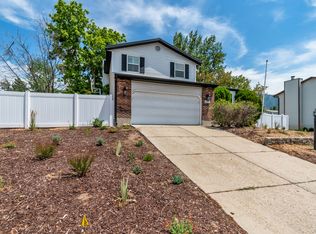
 MLS ID #2172371, Ashley E Vongsawad, Peace Tree Realty LLC. UtahRealEstate.com
- $660,0005 bd3 ba2.2k sqft9626 S Flint Dr, Sandy, UT 84094For Sale
 MLS ID #2189721, Justin McQuarrie, Windermere Real Estate (Park Ave). UtahRealEstate.com
- $689,9004 bd3 ba2.2k sqft9495 S Pinedale Cir, Sandy, UT 84092For Sale
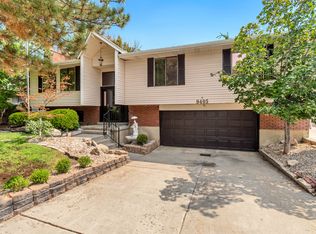 MLS ID #2178209, Jonathan Hall, Hallmark Real Estate Company of Utah. UtahRealEstate.com
- $599,8003 bd2 ba2.1k sqft10273 S Countrywood Dr, Sandy, UT 84092For Sale
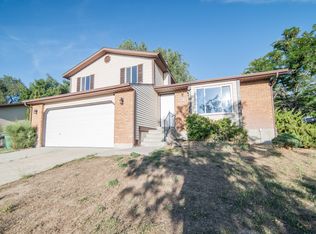 MLS ID #2185481, Brian Summers, Century 21 Wasatch Life Realty. UtahRealEstate.com
- $679,5004 bd3 ba1.8k sqft845 E Larkspur Dr, Sandy, UT 84094For SaleMLS ID #2174064, Robert Seitz, Equity Real Estate (Solid). UtahRealEstate.com
- $679,9005 bd3 ba1.8k sqft8287 S Valencia Cir, Sandy, UT 84093For SaleMLS ID #2180181, Renzo S Vargas, Real Broker, LLC. UtahRealEstate.com
- $635,0005 bd3 ba2.1k sqft8523 S Kelsch Dr, Sandy, UT 84093For SaleMLS ID #2186142, Joel Carson, Utah Real Estate PC. UtahRealEstate.com
- $675,0005 bd3 ba2.2k sqft12152 S Cinnamon Ridge Rd, Sandy, UT 84094For SaleMLS ID #2174756, Vince Craig, Craig Realty Inc. UtahRealEstate.com
- $574,9004 bd2 ba1.7k sqft9640 S Flint Dr, Sandy, UT 84094For SaleMLS ID #2180768, Jesus Yerena Delgado, Utah's Wise Choice Real Estate. UtahRealEstate.com
- $624,9004 bd3 ba2k sqft2496 E Woodthrush Dr, Sandy, UT 84093For SaleMLS ID #2190947, Robert Seitz, Equity Real Estate (Solid). UtahRealEstate.com
- $555,0005 bd3 ba1.8k sqft9183 S Laura Anne Way, Sandy, UT 84094For SaleMLS ID #2190250, Carolyn Chavez, The Agency Salt Lake City. UtahRealEstate.com
- $653,9005 bd2 ba2.1k sqft2444 Quail Run Dr, Sandy, UT 84093For SaleMLS ID #2160752, Joyce P Walker, RE/MAX Associates. UtahRealEstate.com
- $599,0003 bd3 ba1.9k sqft2196 E Thistlewood Way S, Sandy, UT 84092For SaleMLS ID #2148303, Ronald Thurber, Equity Real Estate (Solid). UtahRealEstate.com
- $635,0005 bd3 ba2k sqft1447 E Mulberry Way, Sandy, UT 84093For Sale
 MLS ID #12604173, Brittainy Gebo, BHHS Utah Properties - SV. PCBR
- $630,0004 bd3 ba1.9k sqft9326 S Alvey Ln, Sandy, UT 84093For SaleMLS ID #2174201, Corbett Simon, Skyline Real Estate Group. UtahRealEstate.com
- $625,0004 bd2 ba2.2k sqft10492 S Columbine Way E, Sandy, UT 84094For SaleMLS ID #2184688, Lisa Shiozaki, Cottonwood Canyons Realty. UtahRealEstate.com
- $599,9005 bd3 ba2.2k sqft8065 S 830 E, Sandy, UT 84094For SaleMLS ID #2189804, Leslie Clement, Berkshire Hathaway HomeServices Utah Properties (Salt Lake). UtahRealEstate.com
- $585,0004 bd3 ba1.8k sqft9280 S Laura Anne Way E, Sandy, UT 84094For SaleMLS ID #2182744, Darren Lum, Berkshire Hathaway HomeServices Utah Properties (Salt Lake). UtahRealEstate.com
- $649,9003 bd2 ba1.8k sqft2088 E Falcon Way, Sandy, UT 84093For SaleMLS ID #2163375, Brendon Drury, Windermere Real Estate (Park Ave). UtahRealEstate.com
- $620,0003 bd2 ba1.7k sqft885 E Winter Canyon Way, Sandy, UT 84094For SaleMLS ID #2189920, David Kevitch, Wasatch Homes and Estates, LLC. UtahRealEstate.com
