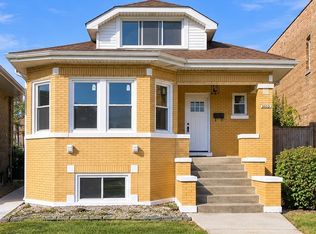
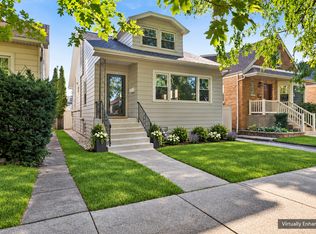
$298,500
2 bd1 ba900 sqft
1941 N 73rd Ave, Elmwood Park, IL 60707
Off Market
Listing description withheld by the listing agent.
Zillow last checked:
Listing updated:
Nick Farnsworth (708)955-7547,
Coldwell Banker Realty,
Nereida Arzola 773-983-1326,
Coldwell Banker Realty

Not available
Estimated sales range
Not available
Not available
| Date | Event | Price |
|---|---|---|
| 10/23/2026 | Listed for sale | $535,000+30.8%$202/sqft |
Source:  MRED as distributed by MLS GRID #12778838 Report a problem | ||
| 2/4/2021 | Sold | $409,000$154/sqft |
Source: Public Record Report a problem | ||
| 9/17/2020 | Sold | $409,000+2.3%$154/sqft |
Source: MRED as distributed by MLS GRID #10802256 Report a problem | ||
| 8/9/2020 | Pending sale | $399,900$151/sqft |
Source: Redfin Corporation #10802256 Report a problem | ||
| 8/6/2020 | Listed for sale | $399,900+3.1%$151/sqft |
Source: Redfin Corporation #10802256 Report a problem | ||
| 12/5/2018 | Sold | $388,000-5.1%$146/sqft |
Source: MRED as distributed by MLS GRID #10071348 Report a problem | ||
| 12/3/2018 | Pending sale | $409,000$154/sqft |
Source: Gagliardo Realty Associates LLC #10071348 Report a problem | ||
| 9/28/2018 | Price change | $409,000-2.4%$154/sqft |
Source: Gagliardo Realty Associates LLC #10071348 Report a problem | ||
| 9/4/2018 | Price change | $419,000-2.3%$158/sqft |
Source: Gagliardo Realty Associates LLC #10071348 Report a problem | ||
| 6/19/2018 | Price change | $429,000-4.5%$162/sqft |
Source: Gagliardo Realty Associates LLC #10071348 Report a problem | ||
| 6/2/2018 | Listed for sale | $449,000+107.9%$169/sqft |
Source: Gagliardo Realty Associates LLC #10071348 Report a problem | ||
| 12/20/2017 | Sold | $216,000+8.5%$81/sqft |
Source: Public Record Report a problem | ||
| 11/11/2017 | Pending sale | $199,000$75/sqft |
Source: Gagliardo Realty Associates LLC #09797655 Report a problem | ||
| 11/9/2017 | Listed for sale | $199,000$75/sqft |
Source: Gagliardo Realty Associates LLC #09797655 Report a problem | ||
| Year | Property taxes | Tax assessment |
|---|---|---|
| 2024 | $11,132 +3.1% | $40,168 +3% |
| 2023 | $10,799 -5.7% | $38,999 |
| 2022 | $11,452 +37% | $38,999 +52.4% |
| 2021 | $8,358 +2.5% | $25,583 |
| 2020 | $8,158 +10.9% | $25,583 -10.7% |
| 2019 | $7,355 -22.7% | $28,649 -2.3% |
| 2018 | $9,520 +16.9% | $29,322 |
| 2017 | $8,145 +7.3% | $29,322 |
| 2016 | $7,595 +6.7% | $29,322 +14.8% |
| 2015 | $7,119 +2.4% | $25,535 |
| 2014 | $6,952 +2.8% | $25,535 |
| 2013 | $6,764 -4.2% | $25,535 -14.9% |
| 2012 | $7,063 +1.5% | $29,997 |
| 2011 | $6,959 -0.2% | $29,997 |
| 2010 | $6,972 +12.6% | $29,997 -13.5% |
| 2009 | $6,191 +0.2% | $34,684 -12% |
| 2008 | $6,181 +10.7% | $39,413 |
| 2007 | $5,585 -5.6% | $39,413 +23.4% |
| 2006 | $5,916 +7.4% | $31,952 |
| 2005 | $5,507 +2.1% | $31,952 |
| 2004 | $5,393 -4.8% | $31,952 +21.7% |
| 2003 | $5,664 +2.4% | $26,252 |
| 2002 | $5,530 +13.6% | $26,252 |
| 2001 | $4,870 -10.7% | $26,252 +20.9% |
| 2000 | $5,452 +19% | $21,708 |
| 1999 | $4,581 | $21,708 |
Source: MRED as distributed by MLS GRID. This data may not be complete. We recommend contacting the local school district to confirm school assignments for this home.
A local agent can set up tours, give advice and negotiate with sellers.