$3,341,600
5 bd|3 ba|5.5k sqft
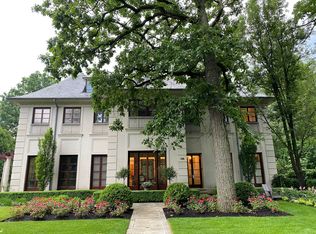
423 Cumnor Rd, Kenilworth, IL 60043
Off Market
Zillow last checked:
Listing updated:
John Mawicke 847-881-0200,
@properties Christie's International Real Estate
Not available
Estimated sales range
Not available
Not available
| Date | Event | Price |
|---|---|---|
| 6/29/2026 | Listed for sale | $3,400,000+63.5%$715/sqft |
Source: | ||
| 9/30/2010 | Sold | $2,080,000-9%$437/sqft |
Source: | ||
| 8/15/2010 | Price change | $2,285,000-4.2%$480/sqft |
Source: The Hudson Company of Winnetka, LLC #07477754 Report a problem | ||
| 7/18/2010 | Price change | $2,385,000-5.5%$501/sqft |
Source: The Hudson Company of Winnetka, LLC #07477754 Report a problem | ||
| 7/16/2010 | Listed for sale | $2,525,000$531/sqft |
Source: The Hudson Company of Winnetka, LLC #07477754 Report a problem | ||
| 6/18/2010 | Pending sale | $2,525,000$531/sqft |
Source: The Hudson Company of Winnetka, LLC #07477754 Report a problem | ||
| 5/14/2010 | Price change | $2,525,000-6.3%$531/sqft |
Source: The Hudson Company of Winnetka, LLC #07477754 Report a problem | ||
| 3/25/2010 | Listed for sale | $2,695,000+120.4%$566/sqft |
Source: The Hudson Company of Winnetka, LLC #07477754 Report a problem | ||
| 8/26/1998 | Sold | $1,222,500$257/sqft |
Source: Public Record Report a problem | ||
| Year | Property taxes | Tax assessment |
|---|---|---|
| 2024 | -- | $152,000 |
| 2023 | $37,394 +6.5% | $152,000 |
| 2022 | $35,108 -6% | $152,000 +17.1% |
| 2021 | $37,341 +2.9% | $129,800 |
| 2020 | $36,286 +3.2% | $129,800 -9% |
| 2019 | $35,162 +0.1% | $142,638 +2% |
| 2018 | $35,138 +3% | $139,803 |
| 2017 | $34,114 +5.4% | $139,803 |
| 2016 | $32,358 -34.6% | $139,803 -25.4% |
| 2015 | $49,469 +2.7% | $187,524 |
| 2014 | $48,188 +6.1% | $187,524 |
| 2013 | $45,411 +25% | $187,524 +15.6% |
| 2012 | $36,317 +4.3% | $162,245 |
| 2011 | $34,817 +1.4% | $162,245 |
| 2010 | $34,325 +2.6% | $162,245 -13.6% |
| 2009 | $33,447 -28.9% | $187,681 -34.6% |
| 2008 | $47,027 +2.6% | $286,850 |
| 2007 | $45,830 +11.1% | $286,850 +18.5% |
| 2006 | $41,265 +1.8% | $242,025 |
| 2005 | $40,546 +2.7% | $242,025 |
| 2004 | $39,479 +71.9% | $242,025 +98% |
| 2003 | $22,971 +2.3% | $122,249 |
| 2002 | $22,463 +50.1% | $122,249 |
| 2001 | $14,965 +8.4% | $122,249 +53.1% |
| 2000 | $13,809 | $79,847 |
| 1999 | $13,809 | $79,847 |
Source: MRED as distributed by MLS GRID. This data may not be complete. We recommend contacting the local school district to confirm school assignments for this home.
A local agent can set up tours, give advice and negotiate with sellers.
A local lender can help you make sure your offer is ready when you are.