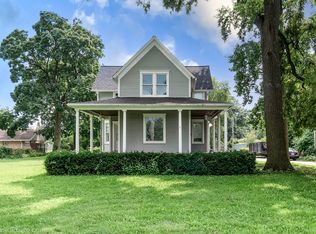
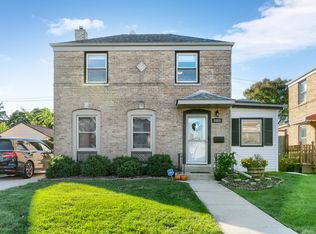
$456,100
4 bd2 ba1.6k sqft
1144 Margret St, Des Plaines, IL 60016
Off Market
Listing description withheld by the listing agent.
Zillow last checked:
Listing updated:
Lisa Lucas 312-502-3515,
Berkshire Hathaway HomeServices Chicago

Not available
Estimated sales range
Not available
Not available
| Date | Event | Price |
|---|---|---|
| 10/24/2026 | Listed for sale | $549,900-8.2%$235/sqft |
Source:  MRED as distributed by MLS GRID #12789538 Report a problem | ||
| 10/20/2026 | Listing removed | $599,000$256/sqft |
Source: MRED as distributed by MLS GRID #12776301 Report a problem | ||
| 10/13/2026 | Contingent | $599,000+69.7%$256/sqft |
Source: MRED as distributed by MLS GRID #12776301 Report a problem | ||
| 10/3/2018 | Sold | $353,000-9.5%$151/sqft |
Source: MRED as distributed by MLS GRID #10008591 Report a problem | ||
| 10/3/2018 | Listed for sale | $389,900$167/sqft |
Source: Baird & Warner #10008591 Report a problem | ||
| 10/3/2018 | Pending sale | $389,900$167/sqft |
Source: Baird & Warner #10008591 Report a problem | ||
| 8/20/2018 | Pending sale | $389,900$167/sqft |
Source: Baird & Warner #10008591 Report a problem | ||
| 7/11/2018 | Price change | $389,900-2.5%$167/sqft |
Source: Baird & Warner #10008591 Report a problem | ||
| 6/15/2018 | Price change | $399,900-4.8%$171/sqft |
Source: Baird & Warner #09955556 Report a problem | ||
| 5/18/2018 | Listed for sale | $419,900$179/sqft |
Source: Baird & Warner #09955556 Report a problem | ||
| Year | Property taxes | Tax assessment |
|---|---|---|
| 2024 | $8,209 +2.3% | $33,743 |
| 2023 | $8,022 -9.8% | $33,743 -11.2% |
| 2022 | $8,898 +18.2% | $37,999 +36.6% |
| 2021 | $7,530 +0.8% | $27,827 |
| 2020 | $7,472 +1% | $27,827 -10% |
| 2019 | $7,398 -16.8% | $30,919 +4% |
| 2018 | $8,888 +28% | $29,720 |
| 2017 | $6,946 -1.7% | $29,720 |
| 2016 | $7,069 +9.6% | $29,720 +15.1% |
| 2015 | $6,449 +1.7% | $25,829 |
| 2014 | $6,341 -5.3% | $25,829 |
| 2013 | $6,695 -10.4% | $25,829 -19.7% |
| 2012 | $7,473 +3.1% | $32,175 |
| 2011 | $7,247 +0.6% | $32,175 |
| 2010 | $7,201 +0.5% | $32,175 -15.8% |
| 2009 | $7,165 +10.6% | $38,195 -12% |
| 2008 | $6,481 +11.7% | $43,403 |
| 2007 | $5,803 +4.9% | $43,403 +23.8% |
| 2006 | $5,530 +4.8% | $35,059 |
| 2005 | $5,279 +5.6% | $35,059 |
| 2004 | $4,998 +9.4% | $35,059 +28% |
| 2003 | $4,569 +3% | $27,392 |
| 2002 | $4,435 +7.3% | $27,392 |
| 2001 | $4,134 +1.4% | $27,392 +9.3% |
| 2000 | $4,075 +2.7% | $25,051 |
| 1999 | $3,967 | $25,051 |
Source: MRED as distributed by MLS GRID. This data may not be complete. We recommend contacting the local school district to confirm school assignments for this home.
A local agent can set up tours, give advice and negotiate with sellers.