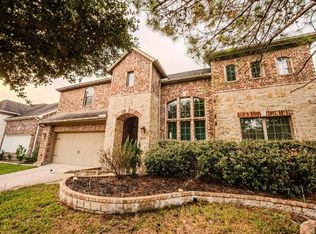
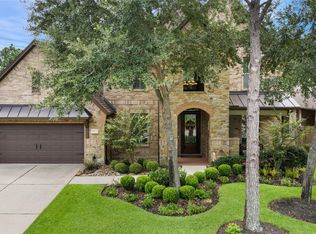
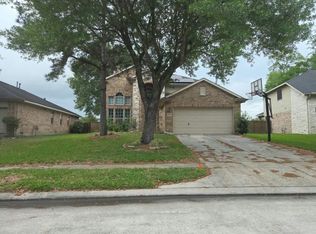
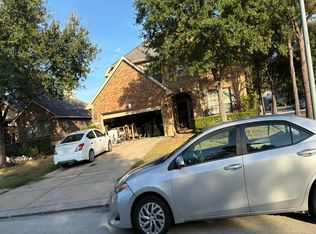
$479,200
5 bd4 ba3.7k sqft
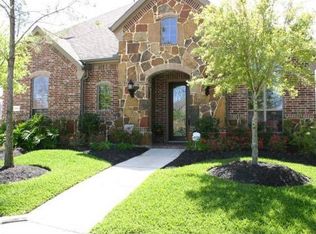
12003 Tower Falls Ct, Humble, TX 77346
Off Market
Likely to sell faster than
Zillow last checked:
Listing updated:
Monica Humphrey TREC #0669897 281-455-3110,
Keller Williams Realty Northeast,
Stacey Stidham TREC #0756490 832-338-4411,
Keller Williams Realty Northeast

$539,100
$512,000 - $566,000
$3,602/mo
| Date | Event | Price |
|---|---|---|
| 11/12/2026 | Listed for sale | $550,000+57.1%$147/sqft |
Source:  HAR #93509713 Report a problem | ||
| 7/25/2019 | Listing removed | $350,000$94/sqft |
Source: Keller Williams Realty #43834876 Report a problem | ||
| 7/25/2019 | Listed for sale | $350,000$94/sqft |
Source: Keller Williams Realty #43834876 Report a problem | ||
| 6/27/2019 | Pending sale | $350,000$94/sqft |
Source: KELLER WILLIAMS REALTY NORTHEAST #43834876 Report a problem | ||
| 3/29/2019 | Listing removed | $2,700$1/sqft |
Source: KELLER WILLIAMS REALTY NORTHEAST #34176219 Report a problem | ||
| 2/6/2019 | Listed for rent | $2,700$1/sqft |
Source: Keller Williams Realty #34176219 Report a problem | ||
| 11/28/2018 | Listed for sale | $350,000$94/sqft |
Source: KELLER WILLIAMS REALTY NORTHEAST #43834876 Report a problem | ||
| 11/4/2018 | Pending sale | $350,000$94/sqft |
Source: KELLER WILLIAMS REALTY NORTHEAST #67874846 Report a problem | ||
| 5/25/2018 | Listed for sale | $350,000$94/sqft |
Source: KELLER WILLIAMS REALTY NORTHEAST #67874846 Report a problem | ||
| 3/19/2018 | Pending sale | $350,000$94/sqft |
Source: Keller Williams Realty #27208375 Report a problem | ||
| 8/8/2017 | Price change | $350,000-6.7%$94/sqft |
Source: Houston-Northeast #27208375 Report a problem | ||
| 7/12/2017 | Listed for sale | $375,000$100/sqft |
Source: Keller Williams Realty Northeast #27208375 Report a problem | ||
| Year | Property taxes | Tax assessment |
|---|---|---|
| 2025 | $3,490 +3.4% | $498,129 +1.2% |
| 2024 | $3,377 +17.5% | $492,300 -7.9% |
| 2023 | $2,873 +8.6% | $534,541 +15.3% |
| 2022 | $2,645 | $463,503 +22.4% |
| 2021 | -- | $378,685 +4.1% |
| 2020 | $2,510 -5.7% | $363,895 +12.8% |
| 2019 | $2,661 -72.1% | $322,722 -0.2% |
| 2018 | $9,533 | $323,502 |
| 2017 | $9,533 +1.5% | $323,502 +0.8% |
| 2016 | $9,392 -1.7% | $321,000 |
| 2015 | $9,557 | $321,000 +5.1% |
| 2014 | $9,557 | $305,303 +9% |
| 2013 | -- | $280,047 |
| 2012 | -- | $280,047 +2.6% |
| 2011 | -- | $272,822 |
| 2010 | -- | $272,822 -10.5% |
| 2009 | -- | $304,833 +42.9% |
| 2007 | -- | $213,383 |
Source: HAR. This data may not be complete. We recommend contacting the local school district to confirm school assignments for this home.

A local agent can set up tours, give advice and negotiate with sellers.