$346,000
1 bd1 ba825 sqft
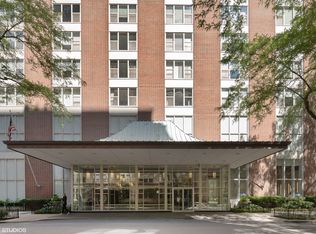
1209 N State St #3, Chicago, IL 60610
Off Market

Listing description withheld by the listing agent.
Likely to sell faster than
Zillow last checked:
Listing updated:
Matt Laricy 708-250-2696,
Americorp, Ltd

Not available
Estimated sales range
Not available
Not available
| Date | Event | Price |
|---|---|---|
| 6/30/2023 | Sold | $330,000+15.4%$413/sqft |
Source:  MRED as distributed by MLS GRID #11805998 Report a problem | ||
| 10/24/2019 | Sold | $286,000-3.1%$358/sqft |
Source: MRED as distributed by MLS GRID #10496257 Report a problem | ||
| 9/19/2019 | Pending sale | $295,000$369/sqft |
Source: @properties #10496257 Report a problem | ||
| 8/25/2019 | Listed for sale | $295,000+13.5%$369/sqft |
Source: @properties #10496257 Report a problem | ||
| 2/5/2019 | Listing removed | $1,795$2/sqft |
Source: The Lathan-Rizzo Team - Fulton Grace Realty Report a problem | ||
| 1/14/2019 | Price change | $1,795-2.4%$2/sqft |
Source: The Lathan-Rizzo Team - Fulton Grace Realty Report a problem | ||
| 1/4/2019 | Listed for rent | $1,839-12.4%$2/sqft |
Source: Carlson Realty Group Report a problem | ||
| 11/11/2018 | Listing removed | $2,100$3/sqft |
Source: MCGAVEN HOMES Report a problem | ||
| 8/25/2018 | Price change | $2,100+5%$3/sqft |
Source: rick-smits Report a problem | ||
| 5/28/2018 | Listed for rent | $2,000+37.9%$3/sqft |
Source: J-Hancok Report a problem | ||
| 1/16/2015 | Listing removed | $1,450$2/sqft |
Source: Generation Rent LLC Report a problem | ||
| 12/18/2014 | Listed for rent | $1,450$2/sqft |
Source: Generation Rent LLC Report a problem | ||
| 6/5/2006 | Sold | $260,000+4.8%$325/sqft |
Source: Public Record Report a problem | ||
| 12/1/2004 | Sold | $248,000-49.2%$310/sqft |
Source: Public Record Report a problem | ||
| 4/4/2002 | Sold | $488,500$611/sqft |
Source: Public Record Report a problem | ||
| Year | Property taxes | Tax assessment |
|---|---|---|
| 2024 | $6,371 +39.3% | $31,713 +26.9% |
| 2023 | $4,575 +3.1% | $24,999 |
| 2022 | $4,438 -11.7% | $24,999 |
| 2021 | $5,027 -3.3% | $24,999 +7.1% |
| 2020 | $5,201 +18.2% | $23,348 -7.8% |
| 2019 | $4,401 +1.7% | $25,336 |
| 2018 | $4,326 +3.4% | $25,336 +11.1% |
| 2017 | $4,184 +2.8% | $22,812 |
| 2016 | $4,069 +10% | $22,812 |
| 2015 | $3,700 +21.2% | $22,812 +19.9% |
| 2014 | $3,053 +2.4% | $19,025 |
| 2013 | $2,982 +0.5% | $19,025 |
| 2012 | $2,966 0% | $19,025 -6.4% |
| 2011 | $2,967 -1.5% | $20,331 |
| 2010 | $3,012 +4.1% | $20,331 |
| 2009 | $2,893 -9.9% | $20,331 -16.1% |
| 2008 | $3,212 +0.6% | $24,240 |
| 2007 | $3,193 -9.4% | $24,240 -8.2% |
| 2006 | $3,525 -18.3% | $26,403 0% |
| 2005 | $4,314 +1% | $26,404 |
| 2004 | $4,271 +9.8% | $26,404 |
| 2003 | $3,889 | $26,404 +220.6% |
| 2001 | -- | $8,235 |
Source: MRED as distributed by MLS GRID. This data may not be complete. We recommend contacting the local school district to confirm school assignments for this home.


A local agent can set up tours, give advice and negotiate with sellers.