This 2170 square foot single family home has 3 bedrooms and 1.5 bathrooms. This home is located at 1615 N Sparks Ferry Rd, Salem, IN 47167.
Foreclosed
Street View
Est. $235,900
1615 N Sparks Ferry Rd, Salem, IN 47167
3beds
1baths
2,170sqft
SingleFamily
Built in 1957
1 Acres Lot
$235,900 Zestimate®
$109/sqft
$-- HOA
Overview
- 36 days
- 13
- 0
Facts & features
Interior
Bedrooms & bathrooms
- Bedrooms: 3
- Bathrooms: 1.5
Heating
- Other
Cooling
- Central
Features
- Basement: None
- Has fireplace: Yes
- Fireplace features: masonry
Interior area
- Total interior livable area: 2,170 sqft
Property
Parking
- Parking features: Garage - Attached
Lot
- Size: 1 Acres
Details
- Parcel number: 882408000016000021
Construction
Type & style
- Home type: SingleFamily
Materials
- Frame
- Foundation: Crawl/Raised
- Roof: Asphalt
Condition
- Year built: 1957
Community & HOA
Location
- Region: Salem
Financial & listing details
- Price per square foot: $109/sqft
- Tax assessed value: $196,300
- Annual tax amount: $1,127
Foreclosure details
Estimated market value
$235,900
$212,000 - $257,000
$1,721/mo
Price history
| Date | Event | Price |
|---|---|---|
| 9/23/2026 | Sold | $200,039-4.3%$92/sqft |
Source: Public Record Report a problem | ||
| 7/11/2022 | Listing removed | -- |
Source:  MIBOR as distributed by MLS GRID #21859049 Report a problem | ||
| 7/7/2022 | Listed for sale | $209,000$96/sqft |
Source: MIBOR as distributed by MLS GRID #21859049 Report a problem | ||
| 6/27/2022 | Pending sale | $209,000$96/sqft |
Source: MIBOR as distributed by MLS GRID #21859049 Report a problem | ||
| 6/9/2022 | Price change | $209,000-5%$96/sqft |
Source: MIBOR as distributed by MLS GRID #21859049 Report a problem | ||
| 5/31/2022 | Pending sale | $219,900$101/sqft |
Source: MIBOR as distributed by MLS GRID #21859049 Report a problem | ||
| 5/26/2022 | Listed for sale | $219,900+109.4%$101/sqft |
Source: MIBOR as distributed by MLS GRID #21859049 Report a problem | ||
| 1/31/2020 | Sold | $105,000+61.8%$48/sqft |
Source: Public Record Report a problem | ||
| 7/23/2015 | Sold | $64,900$30/sqft |
Source:  SIRA #201503079 Report a problem | ||
Public tax history
| Year | Property taxes | Tax assessment |
|---|---|---|
| 2025 | $1,127 +16% | $196,300 +9.2% |
| 2024 | $971 +2.7% | $179,800 +7.2% |
| 2023 | $946 +17.3% | $167,800 +4.2% |
| 2022 | $806 +35.4% | $161,000 +13.2% |
| 2021 | $595 -42.6% | $142,200 +8.9% |
| 2020 | $1,037 +13.5% | $130,600 +2% |
| 2019 | $913 -20.5% | $128,000 +9.6% |
| 2018 | $1,150 +75.5% | $116,800 -2.7% |
| 2017 | $655 +321.3% | $120,100 +0.9% |
| 2016 | $155 +2.1% | $119,000 -0.4% |
| 2014 | $152 +19.6% | $119,500 +2.5% |
| 2013 | $127 -41.4% | $116,600 -8.5% |
| 2012 | $217 -58.7% | $127,500 -20.5% |
| 2011 | $527 -24% | $160,300 -3.8% |
| 2010 | $693 +22.6% | $166,700 +3.6% |
| 2009 | $565 -4.1% | $160,900 +3.5% |
| 2007 | $589 -65.9% | $155,400 -10.7% |
| 2006 | $1,726 | $174,000 |
Find assessor info on the county website
Monthly payment
Climate risks
Neighborhood: 47167

Similar homes
- $240,0003 bd2 ba1.7k sqft101 Oakwood Drive, Salem, IN 47167For Sale
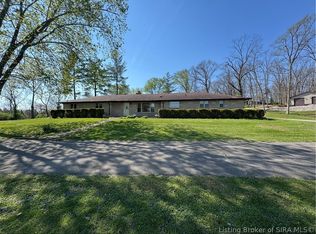 MLS ID #2026012715, Thomas S. Day, The Day Company Realtors & Auctioneers. SIRA
- $240,0005 bd2 ba2.4k sqft3384 E State Road 160, Salem, IN 47167For Sale
 MLS ID #2026011608, Sherri B. Purkhiser, The Day Company Realtors & Auctioneers. SIRA
- $229,0003 bd2 ba1.5k sqft116 Bruce Street, Salem, IN 47167For Sale
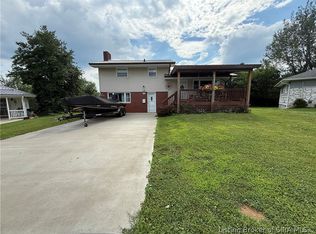 MLS ID #202609960, Melanie Wells, HOOSIER REALTY. SIRA
- $--3 bd2 ba2.3k sqft305 E Mulberry St, Salem, IN 47167Auction
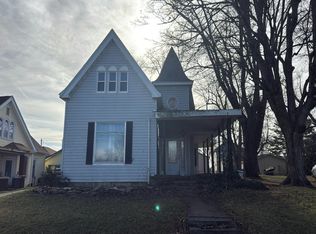 Auction.com 1
