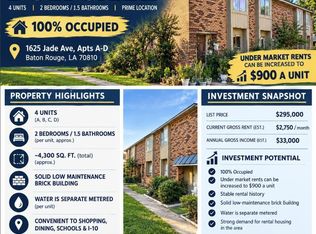
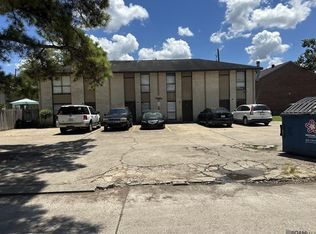
SOUTH BATON ROUGE MULTIFAMILY PORTFOLIO 20 Units | 5 Fourplexes | $1,425,000 Portfolio Offering Commercial Property Advisors is pleased to present a 20-unit multifamily portfolio located in a high-demand South Baton Rouge rental area approximately three miles south of LSU. The offering consists of five fourplexes and is available as a complete portfolio or as individual properties. INVESTMENT HIGHLIGHTS • 20 Total Units • 94.7% Current Occupancy • $14,260 Monthly Gross Scheduled Income • $171,120 Annual Gross Scheduled Income • $1,425,000 Portfolio Asking Price • Five Fourplexes • Approximately 3 Miles South of LSU • Strong surrounding employment base supporting rental demand • Below-market rents with upside potential • Fourplex market rents avg $775–$850/month per unit • Tenants Pay All Utilities • Washer & Dryer Hookups in Every Unit • Buildings are well maintained • Most roofs approximately two years old or newer
For sale
$1,425,000
1635 Jade Ave, Baton Rouge, LA 70810
--beds
0baths
--sqft
Multi Family
Built in 1984
-- sqft lot
$-- Zestimate®
$--/sqft
$-- HOA
What's special
Buildings are well maintained
- 31 days
- 38
- 2
Zillow last checked:
Listing updated:
Listed by:
David Vercher,
KW Commercial Baton Rouge 225-768-1800
Source: ROAM MLS,MLS#: 2026018661
Facts & features
Interior
Bedrooms & bathrooms
- Bathrooms: 0
Heating
- Central
Cooling
- Central Air
Features
- Solid Surface Counters
Property
Parking
- Total spaces: 40
Lot
- Size: 0.96 Acres
- Dimensions: 60 x 140
Details
- Parcel number: 3595994
Construction
Type & style
- Home type: MultiFamily
- Property subtype: Multi Family
Materials
- Brick, Frame, Wood Siding
- Foundation: Slab
Condition
- Year built: 1984
Utilities & green energy
- Sewer: Public Sewer
- Water: Public
Community & HOA
Community
- Subdivision: South Highland Industrial Park
HOA
- Has HOA: No
Location
- Region: Baton Rouge
Financial & listing details
- Tax assessed value: $159,500
- Annual tax amount: $2,007
- Date on market: 10/14/2026
Estimated market value
Not available
Estimated sales range
Not available
Not available
Price history
| Date | Event | Price |
|---|---|---|
| 10/14/2026 | Listed for sale | $1,425,000+791.2% |
Source:  ROAM MLS #2026018661 Report a problem | ||
| 12/17/2021 | Sold | -- |
Source: ROAM MLS #2021016308 Report a problem | ||
| 11/30/2021 | Pending sale | $159,900 |
Source: ROAM MLS #2021016308 Report a problem | ||
| 11/29/2021 | Listed for sale | $159,900 |
Source: ROAM MLS #2021016308 Report a problem | ||
| 11/18/2021 | Pending sale | $159,900 |
Source: ROAM MLS #2021016308 Report a problem | ||
| 11/16/2021 | Listed for sale | $159,900 |
Source: ROAM MLS #2021016308 Report a problem | ||
| 10/26/2021 | Pending sale | $159,900 |
Source: ROAM MLS #2021016308 Report a problem | ||
| 10/20/2021 | Listed for sale | $159,900 |
Source: ROAM MLS #2021016308 Report a problem | ||
| 9/14/2021 | Sold | -- |
Source: Public Record Report a problem | ||
Public tax history
| Year | Property taxes | Tax assessment |
|---|---|---|
| 2025 | $2,007 -0.4% | $15,950 |
| 2024 | $2,016 -1% | $15,950 |
| 2023 | $2,037 +3% | $15,950 |
| 2022 | $1,978 +62.3% | $15,950 +66.7% |
| 2021 | $1,218 +0.9% | $9,570 |
| 2020 | $1,208 +4.9% | $9,570 +10% |
| 2019 | $1,151 +1.2% | $8,700 |
| 2018 | $1,138 | $8,700 |
| 2017 | $1,138 | $8,700 |
| 2016 | $1,138 +2.3% | $8,700 +2.4% |
| 2015 | $1,112 +4.2% | $8,500 |
| 2014 | $1,067 | $8,500 |
| 2013 | $1,067 +0% | $8,500 |
| 2012 | $1,067 -0.8% | $8,500 |
| 2011 | $1,076 +1% | $8,500 |
| 2010 | $1,065 | $8,500 |
Find assessor info on the county website
Monthly payment
Est. payment
Payment breakdown
Explore the cost of this home by adjusting the details. Changes won't be saved.Climate risks
Neighborhood: South Burbank



Similar homes
- $1,495,0007 bd9 ba5k sqft837 Myrtle View Dr, Baton Rouge, LA 70810For Sale
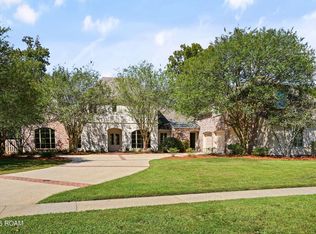
 MLS ID #200HGX, Quita Cutrer, Burns & Co., Inc.. ROAM MLS
- $1,425,0005 bd6 ba5.6k sqft9631 Myrtle Ln, Baton Rouge, LA 70810For Sale
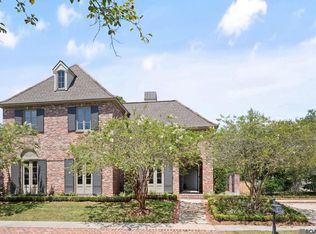 MLS ID #2026015684, Paul Burns, Burns & Co., Inc.. ROAM MLS
- $1,440,0005 bd4 ba3.5k sqft18939 Saint Clare Dr, Baton Rouge, LA 70810For Sale
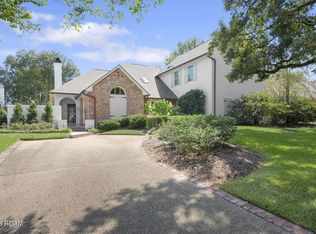 MLS ID #200EDD, Jared Andrew English, Congress Realty, Inc.. ROAM MLS
- $1,170,000-- bd-- ba-- sqft1629 Starboard Dr, Baton Rouge, LA 70820For Sale
 MLS ID #2026018653, David Vercher, KW Commercial Baton Rouge. ROAM MLS
- $1,895,0005 bd4 ba4.3k sqft765 Myrtle View Dr, Baton Rouge, LA 70810For SaleMLS ID #2026017605, Sheri Domingue, Burns & Co., Inc.. ROAM MLS
- $1,575,0004 bd4 ba3.9k sqft18026 Prestwick Ave, Baton Rouge, LA 70810For SaleMLS ID #2026009256, Quita Cutrer, Burns & Co., Inc.. ROAM MLS
- $1,495,0004 bd4 ba4.6k sqft7403 Lanes End, Baton Rouge, LA 70810For SaleMLS ID #2026006872, Jan King, Keller Williams Realty Red Stick Partners. ROAM MLS
- $1,024,0005 bd3 ba3.8k sqft433 Jean Lafitte Ave, Baton Rouge, LA 70810For SaleMLS ID #2026017900, Jill Bueche, Covington & Associates Real Estate, LLC. ROAM MLS
- $749,0004 bd4 ba3.4k sqft222 Shady Lake Pkwy, Baton Rouge, LA 70810For SaleMLS ID #2026018427, Ryan Smith, 1 Percent Lists Premier. ROAM MLS
- $1,488,0004 bd6 ba4.9k sqft11752 Petit Pierre Ave, Baton Rouge, LA 70810For SaleMLS ID #2026011756, David Richardson, Compass - Perkins. ROAM MLS
- $1,099,0004 bd6 ba4k sqft3117 McClendon Ct, Baton Rouge, LA 70810For SaleMLS ID #2026016004, Lauren Johnson, RE/MAX Professional. ROAM MLS
- $1,125,0005 bd4 ba4.8k sqft15425 Victory Hill Ct, Baton Rouge, LA 70810For SaleMLS ID #2026007421, Erin Melancon Alvarez, RE/MAX Professional. ROAM MLS
- $1,395,0004 bd4 ba3.8k sqft3236 Gilbert Dr, Baton Rouge, LA 70809For SaleMLS ID #2026018063, Heather Kirkpatrick, Keller Williams Realty Premier Partners. ROAM MLS
- $1,189,9004 bd4 ba5.1k sqft11447 Center Court Blvd, Baton Rouge, LA 70810For SaleMLS ID #2026015995, Nancy Lovejoy, RE/MAX Professional. ROAM MLS
- $740,0004 bd4 ba3k sqft13434 Kings Court Ave, Baton Rouge, LA 70810For SaleMLS ID #2026018764, Leigh Adams, RE/MAX Professional. ROAM MLS
- $749,0005 bd3 ba3.6k sqft656 Magnolia Wood Ave, Baton Rouge, LA 70808For SaleMLS ID #200SVK, Rhett Sandusky, Keller Williams Realty-First Choice. ROAM MLS
- $759,9004 bd4 ba2.9k sqft3110 Veranda Lakes Dr, Baton Rouge, LA 70810For SaleMLS ID #200QWW, Raegan Narcomey, Hammett Group Real Estate, LLC. ROAM MLS
- $1,975,0007 bd10 ba6.8k sqft13505 N Amiss Rd, Baton Rouge, LA 70810For SaleMLS ID #2026012821, Kayla Luffey, Compass - Perkins. ROAM MLS
- $975,0005 bd3 ba3.6k sqft16676 S Fulwar Skipwith Rd, Baton Rouge, LA 70810For SaleMLS ID #2026018456, Ryn Jones, RE/MAX Professional. ROAM MLS
