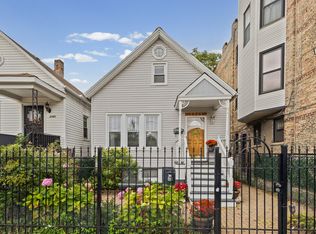
$563,600
1 bd1 ba1.1k sqft
2733 N Artesian Ave #2, Chicago, IL 60647
Off Market

Listing description withheld by the listing agent.
Likely to sell faster than
Zillow last checked:
Listing updated:
Steliana Mladenova 312-721-0764,
Better Homes & Gardens Real Estate,
Igor Jokanovic 773-610-4551,
Better Homes & Gardens Real Estate

Not available
Estimated sales range
Not available
Not available
| Date | Event | Price |
|---|---|---|
| 2/25/2025 | Listing removed | $2,850$2/sqft |
Source: Zillow Rentals Report a problem | ||
| 2/21/2025 | Price change | $2,850-1.7%$2/sqft |
Source: Zillow Rentals Report a problem | ||
| 2/11/2025 | Price change | $2,900-2.5%$2/sqft |
Source: Zillow Rentals Report a problem | ||
| 2/4/2025 | Price change | $2,975-0.8%$2/sqft |
Source: Zillow Rentals Report a problem | ||
| 1/13/2025 | Listed for rent | $3,000$2/sqft |
Source: Zillow Rentals Report a problem | ||
| 12/6/2024 | Listing removed | $3,000-6.3%$2/sqft |
Source: Zillow Rentals Report a problem | ||
| 11/26/2024 | Listed for rent | $3,200$2/sqft |
Source: Zillow Rentals Report a problem | ||
| 11/21/2024 | Sold | $405,000-10%$238/sqft |
Source:  MRED as distributed by MLS GRID #12159272 Report a problem | ||
| 10/18/2024 | Pending sale | $449,900$265/sqft |
Source: MRED as distributed by MLS GRID #12159272 Report a problem | ||
| 10/2/2024 | Contingent | $449,900$265/sqft |
Source: MRED as distributed by MLS GRID #12159272 Report a problem | ||
| 9/9/2024 | Listed for sale | $449,9000%$265/sqft |
Source: MRED as distributed by MLS GRID #12159272 Report a problem | ||
| 9/4/2024 | Listing removed | $450,000$265/sqft |
Source: MRED as distributed by MLS GRID #12113019 Report a problem | ||
| 8/25/2024 | Price change | $450,000-2.2%$265/sqft |
Source: MRED as distributed by MLS GRID #12113019 Report a problem | ||
| 7/16/2024 | Listed for sale | $459,900-6.1%$271/sqft |
Source: MRED as distributed by MLS GRID #12113019 Report a problem | ||
| 7/16/2024 | Listing removed | -- |
Source: MRED as distributed by MLS GRID #12083770 Report a problem | ||
| 6/13/2024 | Listed for sale | $489,900$288/sqft |
Source: MRED as distributed by MLS GRID #12083770 Report a problem | ||
| Year | Property taxes | Tax assessment |
|---|---|---|
| 2024 | $1,226 -5.4% | $51,000 +6.3% |
| 2023 | $1,296 -85% | $48,000 |
| 2022 | $8,636 +596.1% | $48,000 |
| 2021 | $1,241 -3.1% | $48,000 +21.8% |
| 2020 | $1,281 +0.3% | $39,423 -9% |
| 2019 | $1,277 +1.9% | $43,322 |
| 2018 | $1,253 -6.6% | $43,322 +41.5% |
| 2017 | $1,342 -23.2% | $30,627 |
| 2016 | $1,748 +4% | $30,627 |
| 2015 | $1,680 +0.9% | $30,627 +4.6% |
| 2014 | $1,665 -0.4% | $29,271 |
| 2013 | $1,671 +6.8% | $29,271 |
| 2012 | $1,565 +8.4% | $29,271 -13% |
| 2011 | $1,444 -67.8% | $33,642 |
| 2010 | $4,488 +266.5% | $33,642 |
| 2009 | $1,224 -5.7% | $33,642 +1% |
| 2008 | $1,299 -7% | $33,296 |
| 2007 | $1,396 -5.8% | $33,296 |
| 2006 | $1,483 -12.9% | $33,296 +50.6% |
| 2005 | $1,702 -4.8% | $22,114 |
| 2004 | $1,787 -5.7% | $22,114 |
| 2003 | $1,895 -11.6% | $22,114 +40.1% |
| 2002 | $2,144 -10% | $15,786 |
| 2001 | $2,383 +20.5% | $15,786 |
| 2000 | $1,978 +0% | $15,786 +28.4% |
| 1999 | $1,978 | $12,297 |
Source: MRED as distributed by MLS GRID. This data may not be complete. We recommend contacting the local school district to confirm school assignments for this home.


A local agent can set up tours, give advice and negotiate with sellers.
A local lender can help you make sure your offer is ready when you are.