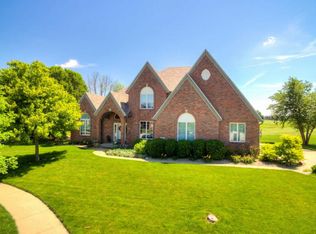
$658,000
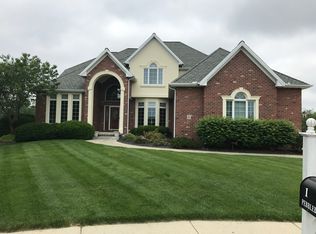
5 bd|6 ba|5.3k sqft
1 Pebblebrook Ct, Bloomington, IL 61705
Off Market
Zillow last checked:
Listing updated:
Jared Litwiller 309-840-5983,
Freedom Realty,
Louis Villafuerte 309-531-4373,
Freedom Realty
$583,700
$555,000 - $613,000
$4,458/mo
| Date | Event | Price |
|---|---|---|
| 6/5/2026 | Price change | $595,000-4.8%$122/sqft |
Source: | ||
| 5/4/2026 | Price change | $625,000-2.3%$128/sqft |
Source: | ||
| 4/10/2026 | Price change | $640,000-0.8%$131/sqft |
Source: | ||
| 2/25/2026 | Price change | $645,000-0.8%$132/sqft |
Source: | ||
| 11/17/2025 | Price change | $650,000-3.7%$133/sqft |
Source: | ||
| 10/24/2025 | Listed for sale | $675,000+30.8%$138/sqft |
Source: | ||
| 7/6/2023 | Sold | $516,000+7.5%$106/sqft |
Source: | ||
| 6/11/2023 | Listing removed | -- |
Source: | ||
| 5/6/2023 | Contingent | $479,900$98/sqft |
Source: | ||
| 5/2/2023 | Listed for sale | $479,900+20%$98/sqft |
Source: | ||
| 6/28/2021 | Sold | $399,900$82/sqft |
Source: | ||
| 5/26/2021 | Pending sale | $399,900$82/sqft |
Source: | ||
| 5/26/2021 | Contingent | $399,900$82/sqft |
Source: | ||
| 5/20/2021 | Listed for sale | $399,900+370.5%$82/sqft |
Source: | ||
| 11/25/2010 | Listing removed | $85,000$17/sqft |
Source: Prudential Real Estate #2102904 Report a problem | ||
| 8/21/2010 | Listed for sale | $85,000-77.4%$17/sqft |
Source: Prudential Real Estate #2102904 Report a problem | ||
| 7/1/2009 | Sold | $376,000-4.2%$77/sqft |
Source: Public Record Report a problem | ||
| 12/14/2006 | Sold | $392,500$80/sqft |
Source: Public Record Report a problem | ||
| Year | Property taxes | Tax assessment |
|---|---|---|
| 2024 | $12,549 +13.3% | $155,403 +13.7% |
| 2023 | $11,074 +6.1% | $136,709 +10.1% |
| 2022 | $10,442 +4% | $124,179 +4.9% |
| 2021 | $10,044 | $118,346 |
| 2020 | -- | $118,346 |
| 2019 | -- | $118,346 |
| 2018 | $9,721 | $118,346 |
| 2017 | $9,721 +4.2% | $118,346 |
| 2016 | $9,327 +1.7% | $118,346 +1.3% |
| 2015 | $9,173 | $116,782 +1.6% |
| 2014 | $9,173 +3.2% | $114,949 |
| 2013 | $8,887 -9.7% | $114,949 -1.1% |
| 2012 | $9,836 | $116,216 -7.2% |
| 2011 | $9,836 +0.5% | $125,247 |
| 2010 | $9,792 -17.3% | $125,247 -17.6% |
| 2009 | $11,838 +0.2% | $151,931 -1.8% |
| 2008 | $11,819 +2.8% | $154,748 +2.6% |
| 2007 | $11,495 | $150,900 +2.5% |
| 2006 | -- | $147,184 +2.1% |
| 2005 | -- | $144,156 +1.8% |
| 2002 | -- | $141,576 +4.1% |
| 2001 | -- | $135,974 +2% |
| 2000 | -- | $133,295 |
Find assessor info on the county website
Source: MRED as distributed by MLS GRID. This data may not be complete. We recommend contacting the local school district to confirm school assignments for this home.
A local agent can set up tours, give advice and negotiate with sellers.
A local lender can help you make sure your offer is ready when you are.