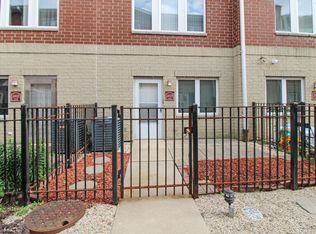
Bridgeport townhouse middle unit with 3 bedrooms and 1 and half baths with full finished basement and outdoor assigned parking. No Assessment fee. Near 62 bus route.
Active
$360,000
3200 S Throop St #B, Chicago, IL 60608
3beds
1,122sqft
Townhouse, Single Family Residence
Built in 2000
-- sqft lot
$356,500 Zestimate®
$321/sqft
$-- HOA
What's special
Full finished basementOutdoor assigned parking
- 44 days
- 592
- 10
Likely to sell faster than
Zillow last checked:
Listing updated:
Listed by:
QianKun Chen 312-515-4617,
Kale Realty
Source: MRED as distributed by MLS GRID,MLS#: 12766457
Facts & features
Interior
Bedrooms & bathrooms
- Bedrooms: 3
- Bathrooms: 2
- Full bathrooms: 1
- 1/2 bathrooms: 1
Rooms
- Room types: No additional rooms
Primary bedroom
- Area: 120 Square Feet
- Dimensions: 12X10
Bedroom 2
- Area: 99 Square Feet
- Dimensions: 11X9
Bedroom 3
- Area: 99 Square Feet
- Dimensions: 11X9
Dining room
- Area: 70 Square Feet
- Dimensions: 7X10
Kitchen
- Area: 60 Square Feet
- Dimensions: 10X6
Laundry
- Area: 40 Square Feet
- Dimensions: 8X5
Living room
- Area: 154 Square Feet
- Dimensions: 14X11
Heating
- Has Heating (Unspecified Type)
Cooling
- Central Air
Features
- Basement: Finished,Full
Interior area
- Total structure area: 0
- Total interior livable area: 1,122 sqft
Property
Parking
- Total spaces: 1
- Parking features: Yes, Owned
Accessibility
- Accessibility features: No Disability Access
Details
- Parcel number: 17321051070000
- Special conditions: List Broker Must Accompany
Construction
Type & style
- Home type: Townhouse
- Property subtype: Townhouse, Single Family Residence
Materials
- Brick
Condition
- New construction: No
- Year built: 2000
Utilities & green energy
- Sewer: Public Sewer
- Water: Public
Community & HOA
HOA
- Services included: None
Location
- Region: Chicago
Financial & listing details
- Price per square foot: $321/sqft
- Tax assessed value: $310,000
- Annual tax amount: $5,772
- Date on market: 9/22/2026
- Ownership: Fee Simple
Estimated market value
$356,500
$339,000 - $374,000
$2,552/mo
Price history
| Date | Event | Price |
|---|---|---|
| 9/22/2026 | Listed for sale | $360,000+3.3%$321/sqft |
Source:  MRED as distributed by MLS GRID #12766457 Report a problem | ||
| 4/4/2023 | Listing removed | -- |
Source: MRED as distributed by MLS GRID #11675643 Report a problem | ||
| 3/18/2023 | Price change | $348,500-1.8%$311/sqft |
Source: MRED as distributed by MLS GRID #11675643 Report a problem | ||
| 11/18/2022 | Listed for sale | $355,000+69%$316/sqft |
Source: MRED as distributed by MLS GRID #11675643 Report a problem | ||
| 10/27/2003 | Sold | $210,000+116.5%$187/sqft |
Source: Public Record Report a problem | ||
| 6/1/1998 | Sold | $97,000$86/sqft |
Source: Public Record Report a problem | ||
Public tax history
| Year | Property taxes | Tax assessment |
|---|---|---|
| 2024 | $5,566 +2.7% | $31,000 +6.9% |
| 2023 | $5,419 +3% | $29,000 |
| 2022 | $5,261 -1.9% | $29,000 -3.3% |
| 2021 | $5,363 +20.6% | $30,000 +30.1% |
| 2020 | $4,448 -0.3% | $23,067 -10% |
| 2019 | $4,460 -2.4% | $25,630 -3.5% |
| 2018 | $4,568 +5.3% | $26,562 +12.9% |
| 2017 | $4,337 +3% | $23,522 |
| 2016 | $4,211 +10% | $23,522 |
| 2015 | $3,830 +10.8% | $23,522 +11% |
| 2014 | $3,456 +2.3% | $21,193 |
| 2013 | $3,376 +11.2% | $21,193 |
| 2012 | $3,035 -6.9% | $21,193 -12.3% |
| 2011 | $3,262 +3.8% | $24,171 |
| 2010 | $3,144 +10.6% | $24,171 |
| 2009 | $2,844 +12.5% | $24,171 -0.7% |
| 2008 | $2,529 +6.6% | $24,342 -5.8% |
| 2007 | $2,373 +27.3% | $25,849 |
| 2006 | $1,864 -5.1% | $25,849 +63% |
| 2005 | $1,965 +1.9% | $15,854 |
| 2004 | $1,929 -23.1% | $15,854 |
| 2003 | $2,509 +28.5% | $15,854 +25% |
| 2002 | $1,952 +5.7% | $12,688 |
| 2001 | $1,847 +7.5% | $12,688 |
| 2000 | $1,719 | $12,688 +15.9% |
| 1999 | -- | $10,946 |
Find assessor info on the county website
Monthly payment
Est. payment
Payment breakdown
Explore the cost of this home by adjusting the details. Changes won't be saved.Climate risks
Neighborhood: Bridgeport
Nearby schools
Similar homes
- $345,0004 bd2 ba1k sqft(Undisclosed Address), Chicago, IL 60608New
 MLS ID #12797692, Javier Alday, Realty of America, LLC. MRED as distributed by MLS GRID
- $380,0003 bd2 ba1.5k sqft941 W 32nd St, Chicago, IL 60608Price Change
 MLS ID #12778610, Camie Cirrincione, Redfin Corporation. MRED as distributed by MLS GRID
- $398,0003 bd3 ba1.5k sqft2409 W 32nd Pl, Chicago, IL 60608Active
 MLS ID #12702727, Ann Martin, Real People Realty. MRED as distributed by MLS GRID
- $325,0002 bd2 ba1.3k sqft1745 W 18th Pl Unit 1R, Chicago, IL 60608Active
 MLS ID #12795178, Tommy Choi, Keller Williams ONEChicago. MRED as distributed by MLS GRID
