$636,300
1 bd|1 ba|900 sqft
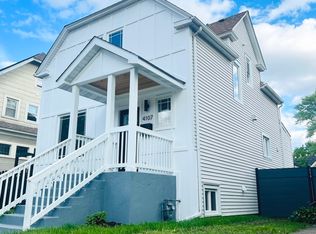
4035 N Keystone Ave, Chicago, IL 60641
Off Market
Zillow last checked:
Listing updated:
Luyang Sue Yang 312-939-5253,
Kale Realty
Not available
Estimated sales range
Not available
Not available
| Date | Event | Price |
|---|---|---|
| 6/29/2026 | Listed for sale | $639,900+212.1%$312/sqft |
Source: | ||
| 5/1/2024 | Listing removed | -- |
Source: Zillow Rentals Report a problem | ||
| 4/22/2024 | Price change | $1,600-11.1%$1/sqft |
Source: Zillow Rentals Report a problem | ||
| 3/25/2024 | Listed for rent | $1,800+94.6%$1/sqft |
Source: Zillow Rentals Report a problem | ||
| 3/8/2017 | Listing removed | $925 |
Source: Keep It Realty, Ltd Report a problem | ||
| 3/7/2017 | Listed for rent | $925 |
Source: Keep It Realty, Ltd. Report a problem | ||
| 5/14/2014 | Sold | $205,000-31.7%$100/sqft |
Source: | ||
| 1/13/2014 | Sold | $300,000+66.8%$146/sqft |
Source: Public Record Report a problem | ||
| 12/7/2012 | Listing removed | $179,900$88/sqft |
Source: Century 21 McMullen #8174122 Report a problem | ||
| 10/20/2012 | Price change | $179,900-10%$88/sqft |
Source: Century 21 McMullen #8174122 Report a problem | ||
| 10/7/2012 | Listed for sale | $199,900-36.5%$98/sqft |
Source: Century 21 McMullen #8174122 Report a problem | ||
| 5/28/2004 | Sold | $315,000+119.5%$154/sqft |
Source: Public Record Report a problem | ||
| 6/29/1994 | Sold | $143,500$70/sqft |
Source: Public Record Report a problem | ||
| Year | Property taxes | Tax assessment |
|---|---|---|
| 2024 | -- | $45,000 +40.6% |
| 2023 | $6,075 +3% | $32,005 |
| 2022 | $5,900 +2% | $32,005 |
| 2021 | $5,785 +1.6% | $32,005 +12% |
| 2020 | $5,694 -2.7% | $28,574 -12% |
| 2019 | $5,854 -9% | $32,471 |
| 2018 | $6,435 +24.7% | $32,471 +35.9% |
| 2017 | $5,160 +7.5% | $23,893 |
| 2016 | $4,802 -8.2% | $23,893 -16% |
| 2015 | $5,231 +7.7% | $28,445 +9% |
| 2014 | $4,858 +5.2% | $26,088 +3.1% |
| 2013 | $4,617 +1.7% | $25,293 |
| 2012 | $4,539 -13.8% | $25,293 -22.1% |
| 2011 | $5,264 -0.4% | $32,487 |
| 2010 | $5,286 +4.4% | $32,487 |
| 2009 | $5,066 +0.7% | $32,487 -7.4% |
| 2008 | $5,033 +1% | $35,084 |
| 2007 | $4,983 -1.1% | $35,084 |
| 2006 | $5,037 +19.9% | $35,084 +36.5% |
| 2005 | $4,201 +1% | $25,708 |
| 2004 | $4,158 +2.2% | $25,708 |
| 2003 | $4,068 +22.7% | $25,708 +39.3% |
| 2002 | $3,316 +16.5% | $18,459 |
| 2001 | $2,846 -3.3% | $18,459 |
| 2000 | $2,942 -0.7% | $18,459 +20.5% |
| 1999 | $2,962 | $15,316 |
Find assessor info on the county website
Source: MRED as distributed by MLS GRID. This data may not be complete. We recommend contacting the local school district to confirm school assignments for this home.
A local agent can set up tours, give advice and negotiate with sellers.