$837,400
2 bd|2 ba|1k sqft
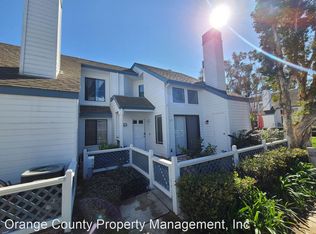
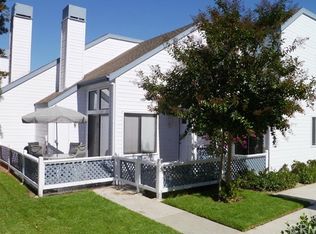
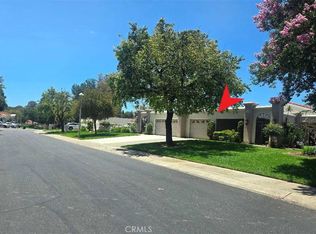
21 Fallingstar #9, Irvine, CA 92614
Off Market
Zillow last checked:
Listing updated:
Jonathan Minerick DRE #01523060 888-400-2513,
Homecoin.com
$946,100
$899,000 - $993,000
$3,567/mo
| Date | Event | Price |
|---|---|---|
| 4/6/2026 | Listed for sale | $957,800-4.2%$781/sqft |
Source: | ||
| 6/9/2024 | Listing removed | -- |
Source: | ||
| 5/26/2024 | Price change | $1,000,000+11.1%$815/sqft |
Source: | ||
| 4/21/2024 | Listed for sale | $900,000$733/sqft |
Source: | ||
| 4/2/2024 | Listing removed | -- |
Source: | ||
| 1/29/2024 | Price change | $900,000+9.8%$733/sqft |
Source: | ||
| 1/4/2024 | Price change | $820,000+5.8%$668/sqft |
Source: | ||
| 12/21/2023 | Listed for sale | $775,000+0.6%$632/sqft |
Source: | ||
| 10/22/2023 | Listing removed | -- |
Source: | ||
| 10/3/2023 | Price change | $770,000-3.8%$628/sqft |
Source: | ||
| 9/20/2023 | Listed for sale | $800,000+18.5%$652/sqft |
Source: | ||
| 12/28/2022 | Sold | $675,000-4.9%$550/sqft |
Source: Public Record Report a problem | ||
| 12/1/2022 | Contingent | $710,000$579/sqft |
Source: | ||
| 11/9/2022 | Price change | $710,000-5.2%$579/sqft |
Source: | ||
| 8/7/2022 | Listed for sale | $749,000+75%$610/sqft |
Source: | ||
| 7/26/2013 | Sold | $428,000+159.4%$349/sqft |
Source: Public Record Report a problem | ||
| 6/23/2012 | Listing removed | $1,875$2/sqft |
Source: Ralph LaVoie, Broker #P821199 Report a problem | ||
| 5/10/2012 | Listed for rent | $1,875$2/sqft |
Source: Ralph LaVoie, Broker #P821199 Report a problem | ||
| 5/28/1999 | Sold | $165,000$134/sqft |
Source: Public Record Report a problem | ||
| Year | Property taxes | Tax assessment |
|---|---|---|
| 2025 | $7,560 +2.1% | $702,270 +2% |
| 2024 | $7,404 -9.8% | $688,500 +2% |
| 2023 | $8,213 +54.3% | $675,000 +36.3% |
| 2022 | $5,324 +2.3% | $495,097 +2% |
| 2021 | $5,205 +0.6% | $485,390 +1% |
| 2020 | $5,175 | $480,413 +2% |
| 2019 | $5,175 +2.2% | $470,994 +2% |
| 2018 | $5,061 +4% | $461,759 +2% |
| 2017 | $4,868 | $452,705 +2% |
| 2016 | $4,868 +4.6% | $443,829 +1.5% |
| 2015 | $4,653 +3.5% | $437,163 +2% |
| 2014 | $4,495 | $428,600 +104% |
| 2013 | -- | $210,053 +2% |
| 2012 | -- | $205,935 +2% |
| 2011 | -- | $201,898 +0.8% |
| 2010 | -- | $200,390 -0.2% |
| 2009 | -- | $200,867 +2% |
| 2008 | -- | $196,929 +2% |
| 2007 | -- | $193,068 +2% |
| 2006 | -- | $189,283 +2% |
| 2005 | -- | $185,572 -25.8% |
| 2004 | -- | $249,968 +40% |
| 2003 | -- | $178,600 +2% |
| 2002 | -- | $175,099 +2% |
| 2001 | $1,695 +1.4% | $171,666 +2% |
| 2000 | $1,671 | $168,300 |
Find assessor info on the county website
A local agent can set up tours, give advice and negotiate with sellers.
Local buyer's agents are ready to help