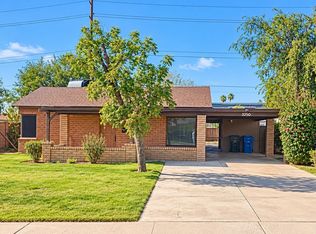
Lender-owned investment opportunity in the desirable Camelback East/Biltmore corridor. 3 bed/2 bath single-family residence on a 6,281 SF lot. Part of a rare 4-property contiguous assemblage on N 24th St, available individually or together. Minutes to Biltmore Fashion Park, Camelback Colonnade, and Town & Country. Sold AS-IS; Seller to make no repairs. Built prior to 1978, lead-based paint disclosure required. Buyer to verify all information.
Foreclosure
$445,000
4336 N 24TH Street, Phoenix, AZ 85016
3beds
1,550sqft
Single Family Residence
Built in 1953
6,281 Square Feet Lot
$-- Zestimate®
$287/sqft
$-- HOA
What's special
- 48 days
- 361
- 17
Zillow last checked:
Listing updated:
Listed by:
Cody Stein 224-769-0880,
HomeSmart
Source: ARMLS,MLS#: 7077751
Facts & features
Interior
Bedrooms & bathrooms
- Bedrooms: 3
- Bathrooms: 2
- Full bathrooms: 2
Heating
- Natural Gas
Cooling
- Central Air
Appliances
- Included: Gas Range
- Laundry: Inside
Features
- Eat-in Kitchen, Full Bth Master Bdrm
- Has basement: No
- Has fireplace: No
Interior area
- Total structure area: 1,550
- Total interior livable area: 1,550 sqft
Property
Features
- Stories: 1
- Spa features: None
- Fencing: Block
Lot
- Size: 6,281 Square Feet
- Features: Dirt Front
Details
- Parcel number: 16333058
- Special conditions: Real Estate Owned
Construction
Type & style
- Home type: SingleFamily
- Property subtype: Single Family Residence
Materials
- Stucco, Block
- Roof: Composition
Condition
- Year built: 1953
Utilities & green energy
- Sewer: Public Sewer
- Utilities for property: Natural Gas Connected
Community & HOA
Community
- Subdivision: CAVALIER VILLA 1
HOA
- Has HOA: No
- Services included: No Fees
Location
- Region: Phoenix
Financial & listing details
- Price per square foot: $287/sqft
- Tax assessed value: $380,000
- Annual tax amount: $2,679
- Date on market: 9/4/2026
- Cumulative days on market: 43 days
- Listing terms: Cash to Loan
- Ownership: Fee Simple
Foreclosure details
Estimated market value
Not available
Estimated sales range
Not available
Not available
Price history
| Date | Event | Price |
|---|---|---|
| 10/22/2024 | Sold | $384,853-14.5%$248/sqft |
Source: Public Record Report a problem | ||
| 3/1/2024 | Sold | $450,000-21.7%$290/sqft |
Source:  ARMLS #6388624 Report a problem | ||
| 1/23/2024 | Listed for sale | $575,000$371/sqft |
Source: ARMLS #6388624 Report a problem | ||
| 9/22/2023 | Contingent | $575,000$371/sqft |
Source: ARMLS #6388624 Report a problem | ||
| 7/12/2022 | Price change | $575,000-4.2%$371/sqft |
Source: ARMLS #6388624 Report a problem | ||
| 6/4/2022 | Price change | $600,000-11.1%$387/sqft |
Source: ARMLS #6388624 Report a problem | ||
| 6/2/2022 | Listed for sale | $675,000$435/sqft |
Source: ARMLS #6388624 Report a problem | ||
| 6/2/2022 | Pending sale | $675,000$435/sqft |
Source: ARMLS #6388624 Report a problem | ||
| 5/23/2022 | Listed for sale | $675,000$435/sqft |
Source: ARMLS #6388624 Report a problem | ||
| 5/18/2022 | Pending sale | $675,000$435/sqft |
Source: ARMLS #6388624 Report a problem | ||
| 4/26/2022 | Listed for sale | $675,000+885.4%$435/sqft |
Source: ARMLS #6388624 Report a problem | ||
| 3/24/2021 | Listing removed | -- |
Source: Owner Report a problem | ||
| 11/6/2018 | Listing removed | $1,500$1/sqft |
Source: Owner Report a problem | ||
| 9/22/2018 | Listed for rent | $1,500+7.1%$1/sqft |
Source: Owner Report a problem | ||
| 10/24/2017 | Listing removed | $1,400$1/sqft |
Source: Owner Report a problem | ||
| 10/1/2017 | Listed for rent | $1,400+3.7%$1/sqft |
Source: Owner Report a problem | ||
| 10/9/2015 | Listing removed | $1,350$1/sqft |
Source: Owner Report a problem | ||
| 9/29/2015 | Listed for rent | $1,350$1/sqft |
Source: Owner Report a problem | ||
| 11/1/1995 | Sold | $68,500$44/sqft |
Source: Public Record Report a problem | ||
Public tax history
| Year | Property taxes | Tax assessment |
|---|---|---|
| 2025 | $2,679 +4.9% | $38,000 -7.4% |
| 2024 | $2,554 +2.7% | $41,050 +120.1% |
| 2023 | $2,486 +3.1% | $18,654 -24.9% |
| 2022 | $2,412 +0.7% | $24,830 +6% |
| 2021 | $2,395 +2.3% | $23,430 +8.6% |
| 2020 | $2,342 +2.5% | $21,580 +6.5% |
| 2019 | $2,285 | $20,270 +5.2% |
| 2018 | $2,285 +4.9% | $19,260 +3.8% |
| 2017 | $2,177 +36.8% | $18,560 +16.4% |
| 2016 | $1,591 +7.1% | $15,950 +17.6% |
| 2015 | $1,486 | $13,560 +31.5% |
| 2014 | -- | $10,310 +11.9% |
| 2013 | -- | $9,210 +13.7% |
| 2012 | -- | $8,100 -28.8% |
| 2011 | -- | $11,370 -23.7% |
| 2010 | -- | $14,910 -17.1% |
| 2009 | -- | $17,980 -2.5% |
| 2008 | -- | $18,450 +14.6% |
| 2007 | -- | $16,100 +47% |
| 2006 | -- | $10,950 |
| 2005 | -- | $10,950 +10.6% |
| 2004 | -- | $9,900 |
| 2003 | -- | $9,900 +41.4% |
| 2002 | -- | $7,000 |
Find assessor info on the county website
Monthly payment
Climate risks
Neighborhood: Camelback East
Nearby schools
Schools provided by the listing agent
- Elementary: Madison Camelview Elementary
- Middle: Madison Park School
- High: Camelback High School
- District: Madison Elementary District
Source: ARMLS. This data may not be complete. We recommend contacting the local school district to confirm school assignments for this home.


Similar homes
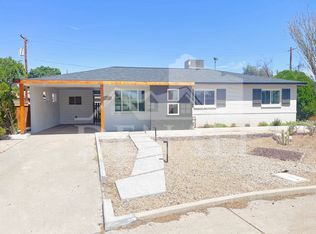
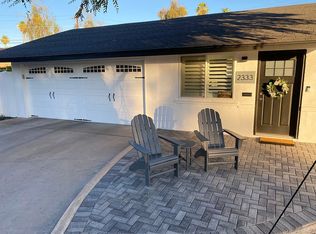
- $430,0003 bd2 ba1.5k sqft1718 E GLENROSA Avenue, Phoenix, AZ 85016For Sale
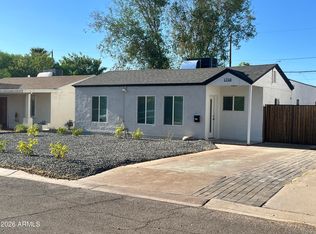 MLS ID #7057736, Joseph Morgan, Lukrom Realty Advisors. ARMLS
- $420,0004 bd2 ba1.7k sqft2841 W CAMPBELL Avenue, Phoenix, AZ 85017For Sale
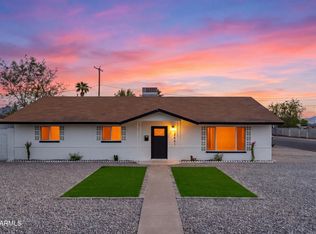 MLS ID #7085373, Manuel Vargas, Realty of America LLC. ARMLS
- $525,0003 bd2 ba1.3k sqft5016 N 21ST Avenue, Phoenix, AZ 85015For Sale
 MLS ID #7074771, Augustine Bartning, APB Valley Spaces. ARMLS
- $395,0003 bd2 ba1.8k sqft3230 E MCKINLEY Street, Phoenix, AZ 85008For Sale
 MLS ID #7061680, Jenohn Netsanet, Vylla Home. ARMLS
