One story with three bedrooms, one full bathroom, attached garage, partially finished basement with laundry and room to add more living space.
Active
Price cut: $15K (10/12)
$249,900
5013 Shoreline Dr, Mound, MN 55364
3beds
1,250sqft
Single Family
Built in 1970
6,098 Square Feet Lot
$249,200 Zestimate®
$200/sqft
$-- HOA
What's special
Attached garageThree bedrooms
- 48 days
- 795
- 41
Likely to sell faster than
Zillow last checked:
Listing updated:
Listed by:
Thomas E Fleetham 952-292-4542,
Lakes Sotheby's International
Source: NorthstarMLS as distributed by MLS GRID,MLS#: 7145149
Facts & features
Interior
Bedrooms & bathrooms
- Bedrooms: 3
- Bathrooms: 1
- Full bathrooms: 1
Bedroom
- Level: Main
- Area: 117 Square Feet
- Dimensions: 13x09
Bedroom 2
- Level: Main
- Area: 110 Square Feet
- Dimensions: 11x10
Bedroom 3
- Level: Main
- Area: 99 Square Feet
- Dimensions: 11x09
Dining room
- Level: Main
- Area: 77 Square Feet
- Dimensions: 11x07
Kitchen
- Level: Main
- Area: 72 Square Feet
- Dimensions: 09x08
Living room
- Level: Main
- Area: 216 Square Feet
- Dimensions: 18x12
Other
- Level: Lower
- Area: 444 Square Feet
- Dimensions: 37x12
Utility room
- Level: Lower
- Area: 407 Square Feet
- Dimensions: 37x11
Heating
- Forced Air
Cooling
- Central Air
Appliances
- Included: Dryer, Range, Refrigerator, Washer
- Laundry: In Basement, Gas Dryer Hookup, Lower Level, Washer Hookup
Features
- Basement: Block,Partial,Partially Finished
- Has fireplace: No
Interior area
- Total structure area: 1,900
- Total interior livable area: 1,250 sqft
- Finished area above ground: 950
- Finished area below ground: 300
Property
Parking
- Total spaces: 1
- Parking features: Attached
- Attached garage spaces: 1
Accessibility
- Accessibility features: None
Features
- Levels: One
- Stories: 1
- Patio & porch: Front Porch, Patio
- Pool features: None
Lot
- Size: 6,098 Square Feet
- Dimensions: 47 x 126
- Features: Tree Coverage - Light
Details
- Foundation area: 950
- Parcel number: 1311724440042
- Zoning description: Residential-Single Family
Construction
Type & style
- Home type: SingleFamily
- Property subtype: Single Family
Materials
- Block, Frame
- Roof: Age Over 8 Years,Asphalt
Condition
- New construction: No
- Year built: 1970
Utilities & green energy
- Electric: Circuit Breakers
- Gas: Natural Gas
- Sewer: City Sewer/Connected
- Water: City Water/Connected
Community & HOA
Community
- Subdivision: Shirley Hills Unit A
HOA
- Has HOA: No
Location
- Region: Mound
Financial & listing details
- Price per square foot: $200/sqft
- Tax assessed value: $213,400
- Annual tax amount: $2,209
- Date on market: 9/16/2026
Estimated market value
$249,200
$237,000 - $262,000
$2,196/mo
Price history
| Date | Event | Price |
|---|---|---|
| 10/12/2026 | Price change | $249,900-5.7%$200/sqft |
Source:  NorthstarMLS as distributed by MLS GRID #7145149 Report a problem | ||
| 9/28/2026 | Price change | $264,900-3.6%$212/sqft |
Source: NorthstarMLS as distributed by MLS GRID #7145149 Report a problem | ||
| 9/16/2026 | Listed for sale | $274,900+1.9%$220/sqft |
Source: NorthstarMLS as distributed by MLS GRID #7145149 Report a problem | ||
| 9/2/2025 | Listing removed | $269,900$216/sqft |
Source: NorthstarMLS as distributed by MLS GRID #6757112 Report a problem | ||
| 8/21/2025 | Price change | $269,900-3.6%$216/sqft |
Source: NorthstarMLS as distributed by MLS GRID #6757112 Report a problem | ||
| 7/30/2025 | Price change | $279,900-3.4%$224/sqft |
Source: NorthstarMLS as distributed by MLS GRID #6757112 Report a problem | ||
| 7/17/2025 | Listed for sale | $289,900+45%$232/sqft |
Source: NorthstarMLS as distributed by MLS GRID #6757112 Report a problem | ||
| 9/15/2023 | Sold | $200,000-11.1%$160/sqft |
Source: NorthstarMLS as distributed by MLS GRID #6406670 Report a problem | ||
| 8/21/2023 | Pending sale | $225,000$180/sqft |
Source: NorthstarMLS as distributed by MLS GRID #6406670 Report a problem | ||
| 8/7/2023 | Price change | $225,000-6.2%$180/sqft |
Source: NorthstarMLS as distributed by MLS GRID #6406670 Report a problem | ||
| 7/24/2023 | Listed for sale | $239,900$192/sqft |
Source: NorthstarMLS as distributed by MLS GRID #6406670 Report a problem | ||
| 7/22/2023 | Listing removed | -- |
Source: NorthstarMLS as distributed by MLS GRID #6380241 Report a problem | ||
| 7/7/2023 | Price change | $239,900-4%$192/sqft |
Source: NorthstarMLS as distributed by MLS GRID #6380241 Report a problem | ||
| 6/22/2023 | Listed for sale | $250,000$200/sqft |
Source: NorthstarMLS as distributed by MLS GRID #6380241 Report a problem | ||
Public tax history
| Year | Property taxes | Tax assessment |
|---|---|---|
| 2026 | $4,317 +16.5% | $213,400 +8.7% |
| 2025 | $3,704 +51.4% | $196,300 -9.3% |
| 2024 | $2,448 +14.8% | $216,400 -12.8% |
| 2023 | $2,132 +3% | $248,100 +7.4% |
| 2022 | $2,070 +1.4% | $231,000 +19.1% |
| 2021 | $2,041 +8.6% | $194,000 +1.6% |
| 2020 | $1,880 -7.9% | $191,000 +13.7% |
| 2019 | $2,041 +8.6% | $168,000 +0.6% |
| 2018 | $1,880 +14.3% | $167,000 +28.5% |
| 2017 | $1,644 +11% | $130,000 +15% |
| 2016 | $1,482 +16.7% | $113,000 -4.2% |
| 2015 | $1,270 -6.7% | $118,000 +34.1% |
| 2014 | $1,361 +22.6% | $88,000 -11.1% |
| 2013 | $1,111 -17.2% | $99,000 -16.8% |
| 2012 | $1,342 -4.4% | $119,000 -10.5% |
| 2011 | $1,404 +4.2% | $133,000 -6.3% |
| 2010 | $1,347 +3.1% | $142,000 -3.4% |
| 2009 | $1,307 -12.2% | $147,000 -3.9% |
| 2006 | $1,488 +4.4% | $153,000 +10.5% |
| 2005 | $1,425 +17.3% | $138,500 +14.9% |
| 2004 | $1,215 +6.2% | $120,500 +12% |
| 2002 | $1,143 -29.4% | $107,600 |
| 2001 | $1,619 | -- |
Find assessor info on the county website
Monthly payment
Est. payment
Payment breakdown
Explore the cost of this home by adjusting the details. Changes won't be saved.Climate risks
Neighborhood: 55364

Similar homes
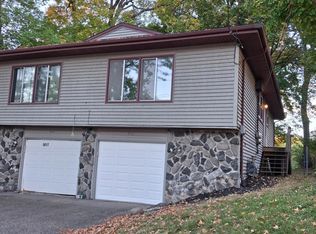
- $295,0002 bd2 ba1.2k sqft4519/4521 Manchester Rd, Mound, MN 55364For Sale
 MLS ID #7132648, Ashley Trulson, Keller Williams Classic Rlty NW. NorthstarMLS as distributed by MLS GRID
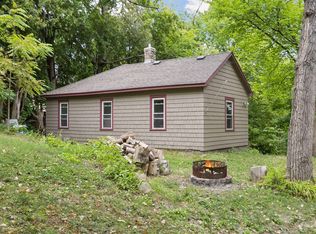
- $334,9003 bd2 ba1.6k sqft4638 Bedford Rd, Mound, MN 55364For Sale
 MLS ID #7136746, Anna Dahlby, Edina Realty, Inc.. NorthstarMLS as distributed by MLS GRID
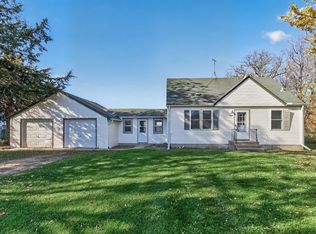
- $249,9003 bd1 ba975 sqft8695 Greenfield Rd, Loretto, MN 55357For Sale
 MLS ID #7163045, Tami Biegert, LPT Realty, LLC. NorthstarMLS as distributed by MLS GRID
- $--2 bd2 ba1.2k sqft7200 Perry Ct E, Brooklyn Center, MN 55429AuctionAuction.com 2
- $249,9003 bd1 ba1.1k sqft5408 34th Pl N, Crystal, MN 55422For SaleMLS ID #7165305, Lisa K Faribault, Keller Williams Realty Integrity Lakes. NorthstarMLS as distributed by MLS GRID
- $250,0002 bd2 ba1.2k sqft10651 Sherman Dr, Eden Prairie, MN 55347For SaleMLS ID #7157589, Paul V Tharp, Coldwell Banker Realty - Lakes. NorthstarMLS as distributed by MLS GRID
- $274,9003 bd2 ba1.4k sqft5940 Rhode Island Ave N, Crystal, MN 55428For SaleMLS ID #7162384, Jerry A Arguello, TWINCITIES.REALESTATE. NorthstarMLS as distributed by MLS GRID
- $299,9004 bd1 ba1.3k sqft402 Jefferson Ave S, Hopkins, MN 55343For SaleMLS ID #7046346, Michael J Sullivan, Coldwell Banker Realty - Lakes. NorthstarMLS as distributed by MLS GRID
- $235,0003 bd2 ba1.3k sqft11971 71st Ave N, Maple Grove, MN 55369For SaleMLS ID #7158269, John M. Kelley, LPT Realty, LLC. NorthstarMLS as distributed by MLS GRID
- $275,0004 bd2 ba1.4k sqft2841 Blackstone Ave S, Saint Louis Park, MN 55416For SaleMLS ID #7139989, Kerby & Cristina Real Estate Experts, RE/MAX Results. NorthstarMLS as distributed by MLS GRID
- $275,0002 bd1 ba1.1k sqft3341 Dakota Ave S, Saint Louis Park, MN 55416For SaleMLS ID #7163443, John Kane, Keller Williams Realty Integrity. NorthstarMLS as distributed by MLS GRID
- $279,9002 bd2 ba1.6k sqft1774 Archer Ct N, Plymouth, MN 55447For SaleMLS ID #7167546, Jason Daley, Bridge Realty, LLC. NorthstarMLS as distributed by MLS GRID
- $245,0003 bd2 ba1.3k sqft706 Oliver Ave N, Minneapolis, MN 55411For SaleMLS ID #7091779, Nam Hoang Nguyen, Pemberton RE. NorthstarMLS as distributed by MLS GRID
- $299,9003 bd2 ba1.7k sqft3125 Boone Ave N, New Hope, MN 55427For SaleMLS ID #7160779, Mallory Johnson, Engel & Volkers Lake Minnetonka. NorthstarMLS as distributed by MLS GRID
- $299,9004 bd3 ba1.6k sqft5217 Greatview Ave, Minneapolis, MN 55429For SaleMLS ID #7044589, Josh A Pomerleau, JPW Realty. NorthstarMLS as distributed by MLS GRID
- $259,9003 bd2 ba1.4k sqft14363 91st Pl N, Maple Grove, MN 55369For SaleMLS ID #7150545, Christopher Fritch, eXp Realty. NorthstarMLS as distributed by MLS GRID
- $278,0003 bd2 ba1.6k sqft4928 Abbott Ave N, Brooklyn Center, MN 55429For SaleMLS ID #7136545, Kerby & Cristina Real Estate Experts, RE/MAX Results. NorthstarMLS as distributed by MLS GRID
- $310,0003 bd2 ba1.4k sqft15393 Trillium Cir, Eden Prairie, MN 55344For SaleMLS ID #7155666, Amber N Broadway, Opendoor Brokerage, LLC. NorthstarMLS as distributed by MLS GRID
- $229,9994 bd1 ba1.4k sqft3343 Colfax Ave N, Minneapolis, MN 55412For SaleMLS ID #7155724, Jonathan Soto, RE/MAX Results. NorthstarMLS as distributed by MLS GRID
- $314,9993 bd1 ba1.3k sqft3620 Sumter Ave S, Saint Louis Park, MN 55426For SaleMLS ID #7157590, Twin Cities Home Group, Real Broker, LLC. NorthstarMLS as distributed by MLS GRID
