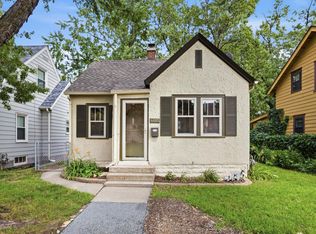
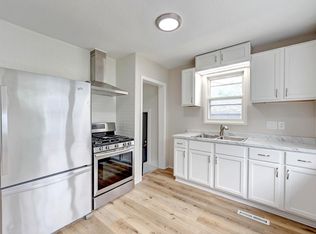
Cute updated home. New: roof, water heater, kitchen, driveway, and so much more!
Active
Price cut: $10.1K (10/19)
$254,900
5729 43rd Ave S, Minneapolis, MN 55417
2beds
774sqft
Single Family
Built in 1931
5,227 Square Feet Lot
$251,200 Zestimate®
$329/sqft
$-- HOA
What's special
- 12 days
- 498
- 40
Zillow last checked:
Listing updated:
Listed by:
Matthew May 763-238-8975,
Trilogy Properties of MN, LLC,
Brenda M. Benson 763-486-7428
Source: NorthstarMLS as distributed by MLS GRID,MLS#: 7156339
Facts & features
Interior
Bedrooms & bathrooms
- Bedrooms: 2
- Bathrooms: 1
- Full bathrooms: 1
Bedroom
- Level: Main
- Area: 100 Square Feet
- Dimensions: 10x10
Bedroom 2
- Level: Main
- Area: 90 Square Feet
- Dimensions: 10x9
Kitchen
- Level: Main
- Area: 117 Square Feet
- Dimensions: 13x9
Living room
- Level: Main
- Area: 180 Square Feet
- Dimensions: 18x10
Heating
- Forced Air
Cooling
- Central Air
Appliances
- Included: Dishwasher, Microwave, Range, Refrigerator, Stainless Steel Appliance(s)
Features
- Basement: Unfinished
- Has fireplace: No
Interior area
- Total structure area: 774
- Total interior livable area: 774 sqft
- Finished area above ground: 774
- Finished area below ground: 0
Property
Parking
- Total spaces: 2
- Parking features: Detached Garage
- Garage spaces: 2
Accessibility
- Accessibility features: None
Features
- Levels: One
- Stories: 1
Lot
- Size: 5,227 Square Feet
- Dimensions: 40 x 128
Details
- Foundation area: 774
- Parcel number: 1902823140150
- Zoning description: Residential-Single Family
Construction
Type & style
- Home type: SingleFamily
- Property subtype: Single Family
Condition
- New construction: No
- Year built: 1931
Utilities & green energy
- Gas: Natural Gas
- Sewer: City Sewer/Connected
- Water: City Water/Connected
Community & HOA
Community
- Subdivision: Minnehaha Highlands
HOA
- Has HOA: No
Location
- Region: Minneapolis
Financial & listing details
- Price per square foot: $329/sqft
- Tax assessed value: $253,700
- Annual tax amount: $3,794
- Date on market: 10/7/2026
Estimated market value
$251,200
$239,000 - $264,000
$1,849/mo
Price history
| Date | Event | Price |
|---|---|---|
| 10/19/2026 | Price change | $254,900-3.8%$329/sqft |
Source:  NorthstarMLS as distributed by MLS GRID #7156339 Report a problem | ||
| 10/7/2026 | Listed for sale | $265,000+278.6%$342/sqft |
Source: NorthstarMLS as distributed by MLS GRID #7156339 Report a problem | ||
| 7/6/2026 | Sold | $70,000$90/sqft |
Source: Public Record Report a problem | ||
Public tax history
| Year | Property taxes | Tax assessment |
|---|---|---|
| 2026 | $3,908 +13.7% | $253,700 +3.1% |
| 2025 | $3,439 +17% | $246,000 +9.8% |
| 2024 | $2,938 -1% | $224,000 -3% |
| 2023 | $2,968 +16.5% | $231,000 |
| 2022 | $2,546 +3.3% | $231,000 +14.9% |
| 2021 | $2,465 -1% | $201,000 |
| 2020 | $2,491 +1.1% | $201,000 +6.1% |
| 2019 | $2,465 -1% | $189,500 +12.1% |
| 2018 | $2,491 +20.3% | $169,000 +24.7% |
| 2017 | $2,071 +10.8% | $135,500 +3% |
| 2016 | $1,869 +0.5% | $131,500 +6% |
| 2015 | $1,860 +2.6% | $124,000 +3.8% |
| 2014 | $1,813 0% | $119,500 -3.6% |
| 2013 | $1,814 -1.7% | $124,000 -3.1% |
| 2012 | $1,846 -1.7% | $128,000 |
| 2011 | $1,877 +9.4% | $128,000 -5.2% |
| 2010 | $1,716 -5.1% | $135,000 -3.2% |
| 2009 | $1,808 +24.7% | $139,500 +15% |
| 2006 | $1,450 +12.4% | $121,300 +15% |
| 2005 | $1,290 +10.4% | $105,500 +14.9% |
| 2004 | $1,169 +14.1% | $91,800 +12% |
| 2002 | $1,024 -52% | $82,000 |
| 2001 | $2,132 | -- |
Find assessor info on the county website
Monthly payment
Est. payment
Payment breakdown
Explore the cost of this home by adjusting the details. Changes won't be saved.Climate risks
Neighborhood: Morris Park
Similar homes
- $209,9002 bd2 ba846 sqft5131 37th Ave S, Minneapolis, MN 55417For Sale

 MLS ID #7134942, Michael P. Forrest, RE/MAX Advantage Plus. NorthstarMLS as distributed by MLS GRID
- $284,9002 bd1 ba948 sqft6015 2nd Ave S, Minneapolis, MN 55419For Sale
 MLS ID #7105206, James Halonen, RE/MAX Results. NorthstarMLS as distributed by MLS GRID
- $275,0002 bd1 ba720 sqft3333 Minnehaha Ave, Minneapolis, MN 55406For Sale
 MLS ID #7069409, Roanne Richardson, Ashworth Real Estate. NorthstarMLS as distributed by MLS GRID
- $250,0002 bd1 ba1k sqft1144 Charles Ave, Saint Paul, MN 55104For Sale
 MLS ID #7152006, Shane M. Montoya, Coldwell Banker Realty. NorthstarMLS as distributed by MLS GRID
- $300,0002 bd1 ba898 sqft3112 E 33rd St, Minneapolis, MN 55406For SaleMLS ID #7155164, Steve Smillie, Edina Realty, Inc.. NorthstarMLS as distributed by MLS GRID
- $249,9002 bd2 ba971 sqft268 Sidney St E, Saint Paul, MN 55107For SaleMLS ID #7153546, The Snyder Team, eXp Realty. NorthstarMLS as distributed by MLS GRID
- $239,9002 bd2 ba1.1k sqft994 Cleveland Ave S, Saint Paul, MN 55116For SaleMLS ID #7131521, Pete Larson, Keller Williams Classic Realty. NorthstarMLS as distributed by MLS GRID
- $309,9002 bd2 ba948 sqft2808 40th Ave S, Minneapolis, MN 55406For SaleMLS ID #7137790, Derek Eley, Mitchell Realty LLC. NorthstarMLS as distributed by MLS GRID
- $265,0003 bd1 ba1k sqft282 Annapolis St W, West Saint Paul, MN 55118For SaleMLS ID #7031739, Nick Mansur, Keller Williams Realty Integrity Lakes. NorthstarMLS as distributed by MLS GRID
- $220,0002 bd2 ba925 sqft2040 Como Ave Unit 104, Saint Paul, MN 55108For SaleMLS ID #7126807, Becky Lund, Edina Realty, Inc.. NorthstarMLS as distributed by MLS GRID
- $255,0002 bd1 ba844 sqft6714 Corvallis Ave N, Crystal, MN 55428For SaleMLS ID #7123896, Jonathan Danielson, Coldwell Banker Realty. NorthstarMLS as distributed by MLS GRID
- $239,9003 bd1 ba1.1k sqft454 Michigan St, Saint Paul, MN 55102For SaleMLS ID #7130094, Martha S Hoover, RE/MAX Preferred. NorthstarMLS as distributed by MLS GRID
- $289,0003 bd2 ba960 sqft744 22nd Ave N, South Saint Paul, MN 55075For SaleMLS ID #7144189, Devin M Harrington, RE/MAX Results. NorthstarMLS as distributed by MLS GRID
- $229,0003 bd1 ba1k sqft1037 Kent St, Saint Paul, MN 55117For SaleMLS ID #7151937, Jackeline Funk, BrBaGa. NorthstarMLS as distributed by MLS GRID
- $229,9002 bd2 ba909 sqft6487 Barrie Rd, Edina, MN 55435For SaleMLS ID #7106511, Andrew Ryan Beitler, National Realty Guild. NorthstarMLS as distributed by MLS GRID
- $215,0002 bd2 ba950 sqft2700 W 44th St APT 104, Minneapolis, MN 55410For SaleMLS ID #7047573, Shae Hanson, Keller Williams Realty Integrity Lakes. NorthstarMLS as distributed by MLS GRID
- $314,5003 bd1 ba940 sqft7327 Columbus Ave, Minneapolis, MN 55423For SaleMLS ID #7133188, Ann Laurent, Coldwell Banker Realty - Lakes. NorthstarMLS as distributed by MLS GRID
- $314,9003 bd1 ba925 sqft7244 10th Ave S, Richfield, MN 55423For SaleMLS ID #7152299, Anthony Nguyen, HOMESTEAD ROAD. NorthstarMLS as distributed by MLS GRID
- $223,5003 bd2 ba1k sqft1331 4th St E, Saint Paul, MN 55106For SaleMLS ID #7127852, Kurtis Pauley, Zarabenny Real Estate LLC. NorthstarMLS as distributed by MLS GRID
