****NOT LOOKING TO LIST WITH REALTOR****
Rare opportunity to purchase 8 acres in Bartlett, Tennessee, featuring a single-family residence.
PROPERTY FEATURES
-Large garage
- Large workshop
- 2-car covered carport
- Wood deck
- Roof approximately 6 years old
SALE CONDITIONS
PROPERTY SOLD AS IS
The seller will make no repairs.
SHOWINGS BY APPOINTMENT ONLY TO PREQUALIFIED BUYERS.
For sale by owner
$575,000
6193 Elmore Rd, Bartlett, TN 38134
3beds
1,850sqft
SingleFamily
Built in 1948
8 Acres Lot
$-- Zestimate®
$311/sqft
$-- HOA
What's special
Large garageLarge workshopWood deck
What the owner loves about this home
Country living in the city.
- 20 days
- 571
- 21
Listed by:
Property Owner (662) 205-8122
Facts & features
Interior
Bedrooms & bathrooms
- Bedrooms: 3
- Bathrooms: 2
- Full bathrooms: 2
Heating
- Forced air, Other
Cooling
- Central
Appliances
- Included: Dishwasher, Dryer, Garbage disposal, Range / Oven, Washer
Features
- Flooring: Hardwood
- Basement: None
- Has fireplace: Yes
Interior area
- Total interior livable area: 1,850 sqft
Property
Parking
- Parking features: Garage - Detached
Features
- Exterior features: Vinyl, Brick
Lot
- Size: 8 Acres
Details
- Parcel number: B016600060C
Construction
Type & style
- Home type: SingleFamily
Materials
- Frame
- Foundation: Crawl/Raised
- Roof: Composition
Condition
- New construction: No
- Year built: 1948
Community & HOA
Location
- Region: Bartlett
Financial & listing details
- Price per square foot: $311/sqft
- Tax assessed value: $229,600
- Annual tax amount: $2,497
- Date on market: 10/17/2026
Estimated market value
Not available
Estimated sales range
Not available
$1,766/mo
Price history
| Date | Event | Price |
|---|---|---|
| 10/17/2026 | Listed for sale | $575,000$311/sqft |
Source: Owner Report a problem | ||
Public tax history
| Year | Property taxes | Tax assessment |
|---|---|---|
| 2025 | $2,497 -1.6% | $57,400 +15.8% |
| 2024 | $2,538 | $49,575 |
| 2023 | $2,538 | $49,575 |
| 2022 | -- | $49,575 |
| 2021 | -- | $49,575 +52.4% |
| 2020 | $595 | $32,525 |
| 2019 | $595 -54.8% | $32,525 |
| 2018 | $1,317 -47% | $32,525 -22.2% |
| 2017 | $2,484 +371.5% | $41,825 +28.6% |
| 2016 | $527 +8.8% | $32,525 |
| 2014 | $484 | $32,525 -15.6% |
| 2013 | -- | $38,525 +18.5% |
| 2012 | -- | $32,500 |
| 2011 | -- | $32,500 -33.3% |
| 2010 | -- | $48,700 |
| 2009 | -- | $48,700 +9.5% |
| 2008 | -- | $44,475 |
| 2007 | -- | $44,475 |
| 2006 | -- | $44,475 -8% |
| 2005 | -- | $48,325 +24.7% |
| 2004 | -- | $38,750 |
| 2003 | -- | $38,750 -5% |
| 2002 | -- | $40,800 -15.7% |
| 2001 | -- | $48,400 +43.4% |
| 2000 | -- | $33,750 |
Find assessor info on the county website
Monthly payment
Est. payment
Payment breakdown
Explore the cost of this home by adjusting the details. Changes won't be saved.Climate risks
Neighborhood: Elmore Park

Similar homes
- $--4 bd3 ba2k sqft3482 Josee Ln, Bartlett, TN 38135Auction
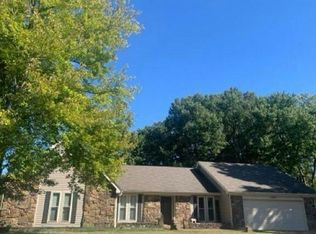 Auction.com 2
- $295,0003 bd3 ba2.6k sqft6102 Sugar Tree Ave, Bartlett, TN 38134For Sale
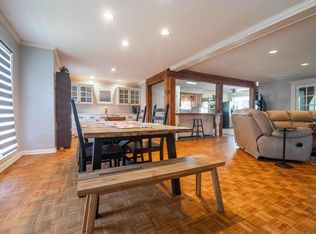
 MLS ID #3545256, Chasity Blackburn. RealTracs MLS as distributed by MLS GRID
- $355,0004 bd2 ba2.4k sqft6435 Gillia Cir S, Bartlett, TN 38135For Sale
 MLS ID #10233965, Frankie Kidd, Crye-Leike, Inc., REALTORS. MAAR
- $359,0003 bd2 ba2k sqft3850 Greenleaf St, Memphis, TN 38135For Sale
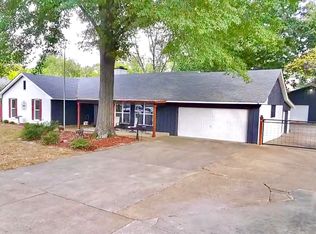 MLS ID #10233636, Justin S Yarbrough, JASCO Realty. MAAR
