$377,600
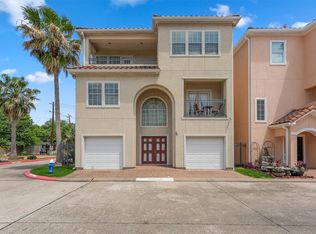
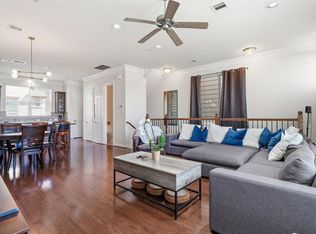
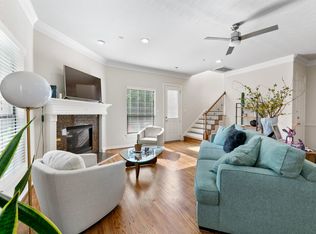
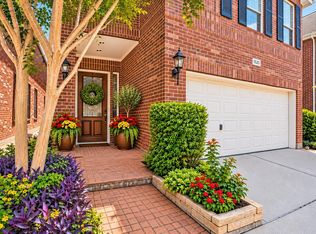
4 bd3 ba2.7k sqft
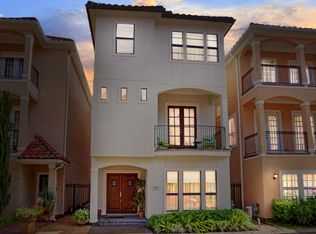
7203 Laguna Villas, Houston, TX 77036
Off Market
Likely to sell faster than
Zillow last checked:
Listing updated:
Rudel Rymer TREC #0599042 832-567-3150,
Texas Ally Real Estate Group, LLC

$335,300
$319,000 - $352,000
$2,621/mo
| Date | Event | Price |
|---|---|---|
| 11/9/2026 | Listed for sale | $350,000-6.7%$132/sqft |
Source:  HAR #33117388 Report a problem | ||
| 11/1/2026 | Listed for rent | $2,600$1/sqft |
Source:  HAR #81875543 Report a problem | ||
| 10/1/2026 | Listing removed | $2,600$1/sqft |
Source: HAR #75000108 Report a problem | ||
| 8/11/2026 | Price change | $2,600-6.3%$1/sqft |
Source: HAR #75000108 Report a problem | ||
| 6/30/2026 | Listed for rent | $2,775-0.9%$1/sqft |
Source: HAR #75000108 Report a problem | ||
| 12/18/2025 | Listed for rent | $2,800$1/sqft |
Source: HAR #75000108 Report a problem | ||
| 11/4/2025 | Listing removed | $2,800$1/sqft |
Source: HAR #88115949 Report a problem | ||
| 10/13/2025 | Price change | $2,800-1.8%$1/sqft |
Source: HAR #88115949 Report a problem | ||
| 5/30/2025 | Listed for rent | $2,850-10.9%$1/sqft |
Source: HAR #88115949 Report a problem | ||
| 3/9/2024 | Listing removed | -- |
Source: Zillow Rentals Report a problem | ||
| 2/17/2024 | Listed for rent | $3,200+6.7%$1/sqft |
Source: Zillow Rentals Report a problem | ||
| 2/7/2024 | Listing removed | -- |
Source: Zillow Rentals Report a problem | ||
| 1/17/2024 | Listed for rent | $3,000$1/sqft |
Source: Zillow Rentals Report a problem | ||
| 9/7/2022 | Listing removed | -- |
Source: HAR #18689452 Report a problem | ||
| 6/28/2022 | Pending sale | $375,000$142/sqft |
Source: HAR #18689452 Report a problem | ||
| 6/20/2022 | Listed for sale | $375,000+39.4%$142/sqft |
Source: HAR #18689452 Report a problem | ||
| 8/2/2009 | Listing removed | $269,000$102/sqft |
Source: Keller Williams Realty -SW #37767408 Report a problem | ||
| 7/10/2009 | Price change | $269,000-1.8%$102/sqft |
Source: Keller Williams Realty -SW #37767408 Report a problem | ||
| 6/21/2009 | Price change | $274,000-1.8%$104/sqft |
Source: Keller Williams Realty #37767408 Report a problem | ||
| 5/2/2009 | Listed for sale | $279,000$105/sqft |
Source: Keller Williams Realty #37767408 Report a problem | ||
| Year | Property taxes | Tax assessment |
|---|---|---|
| 2025 | $8,176 +9.6% | $384,713 +7.9% |
| 2024 | $7,457 -1.3% | $356,408 -5% |
| 2023 | $7,556 -4.9% | $375,000 +3.9% |
| 2022 | $7,947 | $360,915 +14.4% |
| 2021 | -- | $315,572 -3.6% |
| 2020 | $7,852 -0.9% | $327,230 |
| 2019 | $7,924 -10.4% | $327,230 +2.7% |
| 2018 | $8,846 | $318,578 -9% |
| 2017 | $8,846 -0.1% | $350,152 |
| 2016 | $8,854 +19.4% | $350,152 +4.1% |
| 2015 | $7,415 | $336,391 +16.6% |
| 2014 | $7,415 | $288,433 +22.6% |
| 2013 | -- | $235,234 -9.2% |
| 2012 | -- | $258,995 |
| 2011 | -- | $258,995 -7.5% |
| 2010 | -- | $279,900 -8.1% |
| 2009 | -- | $304,460 +5% |
| 2007 | -- | $289,950 +9.5% |
| 2006 | -- | $264,872 |
Source: HAR. This data may not be complete. We recommend contacting the local school district to confirm school assignments for this home.

A local agent can set up tours, give advice and negotiate with sellers.