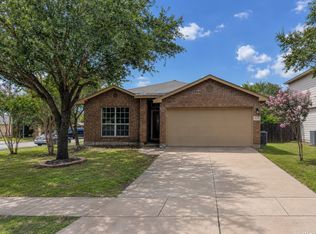
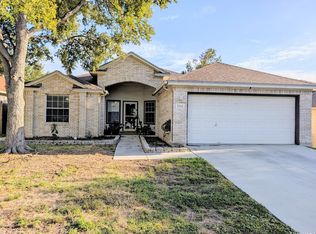
$204,400
3 bd2 ba1.4k sqft
8314 Copperknoll, Converse, TX 78109
Off Market
Likely to sell faster than
Zillow last checked:
Listing updated:
Ankoma Fulwood TREC #0829857 979-985-0220,
RE/MAX Fine Properties

$208,900
$198,000 - $219,000
$1,477/mo
| Date | Event | Price |
|---|---|---|
| 10/23/2026 | Listed for sale | $211,625$168/sqft |
Source:  HAR #54628288 Report a problem | ||
| 2/9/2020 | Listing removed | $1,095$1/sqft |
Source: Global Realty Group #1437174 Report a problem | ||
| 2/5/2020 | Listed for rent | $1,095$1/sqft |
Source: Global Realty Group #1437174 Report a problem | ||
| 1/10/2019 | Listing removed | $1,095$1/sqft |
Source: Global Realty Group #1352662 Report a problem | ||
| 12/6/2018 | Listed for rent | $1,095+6.8%$1/sqft |
Source: Global Realty Group #1352662 Report a problem | ||
| 2/13/2015 | Listing removed | $1,025$1/sqft |
Source: Global Realty Group #1097989 Report a problem | ||
| 2/11/2015 | Listed for rent | $1,025+3%$1/sqft |
Source: Global Realty Group #1097989 Report a problem | ||
| 1/15/2014 | Listing removed | $995$1/sqft |
Source: Global Realty Group #1034515 Report a problem | ||
| 1/1/2014 | Listed for rent | $995+11.2%$1/sqft |
Source: Global Realty Group #1034515 Report a problem | ||
| 1/4/2013 | Listing removed | $895$1/sqft |
Source: Global Realty Group #978693 Report a problem | ||
| 12/29/2012 | Listed for rent | $895$1/sqft |
Source: Global Realty Group #978693 Report a problem | ||
| Year | Property taxes | Tax assessment |
|---|---|---|
| 2026 | -- | $228,480 -0.9% |
| 2025 | $5,047 -0.9% | $230,630 |
| 2024 | $5,095 +0.4% | $230,630 |
| 2023 | $5,072 +5% | $230,630 +13.9% |
| 2022 | $4,831 +20.8% | $202,530 +16.1% |
| 2021 | $3,999 | $174,410 +10% |
| 2020 | $3,999 +13.2% | $158,560 +16.5% |
| 2019 | $3,534 | $136,160 +9.1% |
| 2018 | $3,534 +10.9% | $124,770 +4.7% |
| 2017 | $3,186 +6.5% | $119,130 +8.5% |
| 2016 | $2,991 -1.8% | $109,780 +3.8% |
| 2015 | $3,046 | $105,780 -3.9% |
| 2014 | $3,046 | $110,040 +2.8% |
| 2013 | -- | $107,080 +5.4% |
| 2012 | -- | $101,560 -2.3% |
| 2011 | -- | $103,900 -0.8% |
| 2010 | -- | $104,790 +1.3% |
| 2009 | -- | $103,440 -2.4% |
| 2008 | -- | $105,930 +5.8% |
| 2007 | -- | $100,090 +5.9% |
| 2006 | -- | $94,520 +6.1% |
| 2005 | -- | $89,080 |
| 2004 | -- | -- |
| 2003 | -- | -- |
| 2002 | -- | -- |
| 2001 | -- | -- |
| 2000 | -- | -- |
Source: HAR. This data may not be complete. We recommend contacting the local school district to confirm school assignments for this home.

A local agent can set up tours, give advice and negotiate with sellers.