$387,900
4 bd|2 ba|1k sqft
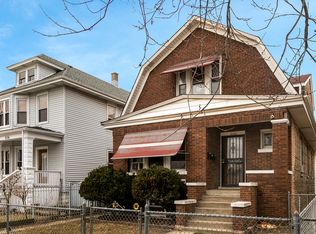
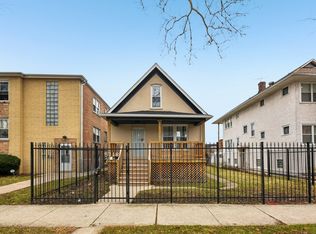
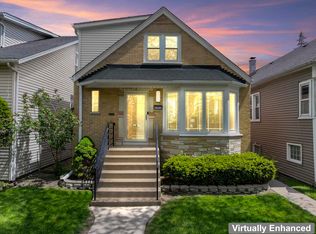
2130 N Lawler Ave, Chicago, IL 60639
Off Market
Likely to sell faster than
Zillow last checked:
Listing updated:
Cassandra Bockman, ABR,GRI (815)385-5505,
Berkshire Hathaway HomeServices Starck Real Estate
Not available
Estimated sales range
Not available
Not available
| Date | Event | Price |
|---|---|---|
| 6/18/2026 | Listed for sale | $650,000+18.2%$308/sqft |
Source: | ||
| 1/13/2023 | Sold | $550,000+0%$261/sqft |
Source: | ||
| 12/7/2022 | Pending sale | $549,900$261/sqft |
Source: | ||
| 12/7/2022 | Contingent | $549,900$261/sqft |
Source: | ||
| 11/3/2022 | Listed for sale | $549,900+116.5%$261/sqft |
Source: | ||
| 4/27/2022 | Sold | $254,000$121/sqft |
Source: Public Record Report a problem | ||
| Year | Property taxes | Tax assessment |
|---|---|---|
| 2024 | -- | $44,000 +41.9% |
| 2023 | $6,544 +2.6% | $31,000 |
| 2022 | $6,380 +2.3% | $31,000 |
| 2021 | $6,238 +9.5% | $31,000 +21.4% |
| 2020 | $5,694 -1.3% | $25,545 -11% |
| 2019 | $5,770 +1.7% | $28,703 |
| 2018 | $5,673 +14.4% | $28,703 +24.7% |
| 2017 | $4,960 +7.5% | $23,026 |
| 2016 | $4,614 +9.3% | $23,026 |
| 2015 | $4,222 +3.9% | $23,026 +5.2% |
| 2014 | $4,063 +2% | $21,884 |
| 2013 | $3,983 +1.3% | $21,884 |
| 2012 | $3,930 -24.5% | $21,884 -31.8% |
| 2011 | $5,205 +22.8% | $32,097 |
| 2010 | $4,240 +3.8% | $32,097 |
| 2009 | $4,083 +5.4% | $32,097 -4.8% |
| 2008 | $3,874 +11% | $33,698 |
| 2007 | $3,490 +28.4% | $33,698 |
| 2006 | $2,719 +26.9% | $33,698 +65% |
| 2005 | $2,143 +4.6% | $20,425 |
| 2004 | $2,049 -36.6% | $20,425 |
| 2003 | $3,235 +45.1% | $20,425 +64.7% |
| 2002 | $2,230 +23.9% | $12,400 |
| 2001 | $1,800 +10.2% | $12,400 |
| 2000 | $1,633 +0.1% | $12,400 +18.3% |
| 1999 | $1,632 | $10,485 |
Source: MRED as distributed by MLS GRID. This data may not be complete. We recommend contacting the local school district to confirm school assignments for this home.
A local agent can set up tours, give advice and negotiate with sellers.