This is a 5 bedroom, 2.0 bathroom, single family home. This home is located at (undisclosed Address), Maywood, IL 60153.
For sale
$649,900
Maywood, IL 60153
5beds
2baths
--sqft
Other
Built in 1888
-- sqft lot
$630,100 Zestimate®
$--/sqft
$-- HOA
What's special
- 100 days
- 10
- 1
Zillow last checked:
Listed by:
Tamekia Strickland,
EXIT STRATEGY REALTY
Source: EXIT Realty broker feed,MLS#: 12708519
Facts & features
Interior
Bedrooms & bathrooms
- Bedrooms: 5
- Bathrooms: 2
Heating
- Natural Gas
Features
- Basement: Unfinished, Full
- Has fireplace: No
Video & virtual tour
Construction
Type & style
- Home type: SingleFamily
- Property subtype: Other
Condition
- Year built: 1888
Community & HOA
Location
- Region: Maywood
Financial & listing details
- Date on market: 7/18/2026
- Lease term: Contact For Details
Estimated market value
$630,100
$599,000 - $662,000
$3,008/mo
Price history
| Date | Event | Price |
|---|---|---|
| 7/18/2026 | Listed for sale | $649,900+170.8% |
Source: EXIT Realty broker feed #12708519 Report a problem | ||
| 10/26/2019 | Sold | $240,000+45.5% |
Source:  MRED as distributed by MLS GRID #10505271 Report a problem | ||
| 6/2/2005 | Sold | $165,000+26.9% |
Source: Public Record Report a problem | ||
| 12/2/1998 | Sold | $130,000 |
Source: Public Record Report a problem | ||
Public tax history
| Year | Property taxes | Tax assessment |
|---|---|---|
| 2024 | $10,275 +8.4% | $22,001 +0% |
| 2023 | $9,478 +8.1% | $21,999 +41.2% |
| 2022 | $8,770 -0.4% | $15,576 |
| 2021 | $8,805 +2.6% | $15,576 |
| 2020 | $8,585 -3.9% | $15,576 +10.2% |
| 2019 | $8,929 +2.8% | $14,132 |
| 2018 | $8,686 +3.5% | $14,132 |
| 2017 | $8,394 +8.7% | $14,132 +13.6% |
| 2016 | $7,725 +7.3% | $12,439 |
| 2015 | $7,201 +9.3% | $12,439 |
| 2014 | $6,585 +6.1% | $12,439 -3.1% |
| 2013 | $6,208 +4.7% | $12,835 |
| 2012 | $5,929 +2.3% | $12,835 |
| 2011 | $5,797 -4.7% | $12,835 -18.1% |
| 2010 | $6,085 +1.4% | $15,674 |
| 2009 | $6,002 +5.4% | $15,674 -5% |
| 2008 | $5,696 -6.5% | $16,499 -5.1% |
| 2007 | $6,092 +3.3% | $17,394 |
| 2006 | $5,895 -1% | $17,394 |
| 2005 | $5,955 +47.5% | $17,394 +53% |
| 2004 | $4,037 +4.8% | $11,369 |
| 2003 | $3,853 -1% | $11,369 |
| 2002 | $3,892 +41.3% | $11,369 +36.5% |
| 2001 | $2,755 +3.6% | $8,330 |
| 2000 | $2,660 +17.8% | $8,330 |
| 1999 | $2,257 | $8,330 |
Monthly payment
Est. payment
Payment breakdown
Explore the cost of this home by adjusting the details. Changes won't be saved.Climate risks
Neighborhood: 60153
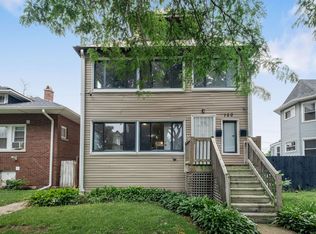
Similar homes
- $399,9006 bd3 ba1.7k sqft417 S 3rd Ave, Maywood, IL 60153Active
 MLS ID #12734377, Ajit Choudhary, Home Network Realty, Inc.. MRED as distributed by MLS GRID
- $399,9996 bd3 ba2.4k sqft1936 S 17th Ave, Maywood, IL 60153Active
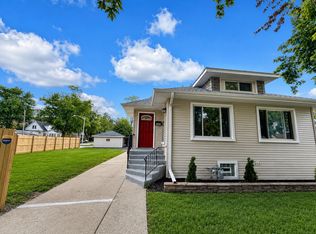 MLS ID #12762904, Jonathan Lopez, Realty of America, LLC. MRED as distributed by MLS GRID
- $649,5005 bd4 ba3.4k sqft3813 N Narragansett Ave, Chicago, IL 60634Active
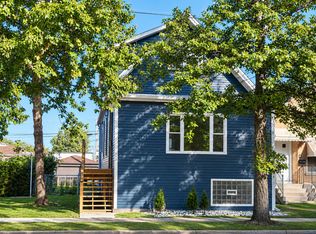 MLS ID #12762620, Andrew Shevelev, American Real Estate Services. MRED as distributed by MLS GRID
- $584,9004 bd3 ba2.3k sqft1648 Wisconsin Ave, Berwyn, IL 60402New
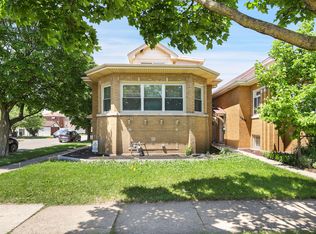 MLS ID #12790497, Carlos Funes, Sky High Real Estate Inc.. MRED as distributed by MLS GRID
