$274,200
3 bd|2 ba|2k sqft
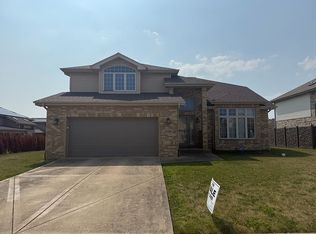
417 Tamarack St, Park Forest, IL 60466
Off Market
Zillow last checked:
Carlos Matos 224-235-4336,
Core Realty & Investments Inc.
$424,900
$404,000 - $446,000
$4,011/mo
| Date | Event | Price |
|---|---|---|
| 11/22/2023 | Sold | $390,000-2.5%$107/sqft |
Source: | ||
| 10/9/2023 | Contingent | $399,900$109/sqft |
Source: | ||
| 9/27/2023 | Listed for sale | $399,900+86%$109/sqft |
Source: | ||
| 5/12/2023 | Sold | $215,000+13.2%$59/sqft |
Source: Public Record Report a problem | ||
| 10/21/2015 | Sold | $190,000-2.5%$52/sqft |
Source: Public Record Report a problem | ||
| 10/14/2014 | Listing removed | $194,900$53/sqft |
Source: RE/MAX Synergy #08584305 Report a problem | ||
| 6/3/2014 | Pending sale | $194,900$53/sqft |
Source: RE/MAX Synergy #08584305 Report a problem | ||
| 5/13/2014 | Price change | $194,900-2.5%$53/sqft |
Source: RE/MAX Synergy #08584305 Report a problem | ||
| 4/14/2014 | Listed for sale | $199,900-11.1%$55/sqft |
Source: RE/MAX Synergy #08584305 Report a problem | ||
| 10/21/2013 | Listing removed | $224,900$62/sqft |
Source: CENTURY 21 Affiliated Pro-Team #08399011 Report a problem | ||
| 7/24/2013 | Listed for sale | $224,900+33.9%$62/sqft |
Source: CENTURY 21 Affiliated Pro-Team #08399011 Report a problem | ||
| 1/24/2011 | Sold | $168,000-1.8%$46/sqft |
Source: Public Record Report a problem | ||
| 11/20/2010 | Pending sale | $171,000$47/sqft |
Source: Smith Partners & Associates #07650681 Report a problem | ||
| 11/4/2010 | Price change | $171,000-10%$47/sqft |
Source: Smith Partners & Associates #07650681 Report a problem | ||
| 10/8/2010 | Listed for sale | $190,000-10.8%$52/sqft |
Source: foreclosure.com Report a problem | ||
| 9/4/2010 | Listing removed | $212,900$58/sqft |
Source: Fannie Mae Report a problem | ||
| 9/2/2010 | Listed for sale | $212,900-49.3%$58/sqft |
Source: foreclosure.com Report a problem | ||
| 6/19/2010 | Listing removed | -- |
Source: foreclosure.com Report a problem | ||
| 5/28/2010 | Listed for sale | -- |
Source: foreclosure.com Report a problem | ||
| 12/12/2007 | Sold | $420,000+24.3%$115/sqft |
Source: Public Record Report a problem | ||
| 11/9/2005 | Sold | $338,000+1175.5%$93/sqft |
Source: Public Record Report a problem | ||
| 7/22/2003 | Sold | $26,500-17.2%$7/sqft |
Source: Public Record Report a problem | ||
| 4/30/1998 | Sold | $32,000$9/sqft |
Source: Public Record Report a problem | ||
| Year | Property taxes | Tax assessment |
|---|---|---|
| 2024 | $20,124 -2.4% | $133,317 +16% |
| 2023 | $20,610 +5.2% | $114,928 +13.7% |
| 2022 | $19,590 +11.1% | $101,098 +7% |
| 2021 | $17,630 -2.9% | $94,506 +3.4% |
| 2020 | $18,148 -0.6% | $91,442 +5.4% |
| 2019 | $18,263 +0.5% | $86,716 +3.2% |
| 2018 | $18,180 +7.1% | $84,005 +4% |
| 2017 | $16,972 +31.4% | $80,788 +3.8% |
| 2016 | $12,920 -9.6% | $77,830 +8.3% |
| 2015 | $14,296 | $71,853 +1.4% |
| 2014 | $14,296 +3.7% | $70,861 -4.5% |
| 2013 | $13,785 -10% | $74,200 -16.8% |
| 2012 | $15,314 +11.8% | $89,133 -15.2% |
| 2011 | $13,693 -7.5% | $105,122 -11.8% |
| 2010 | $14,799 +4.8% | $119,212 -7.9% |
| 2009 | $14,118 +2.1% | $129,500 |
| 2008 | $13,823 | $129,500 +18.6% |
| 2007 | -- | $109,200 +0.5% |
| 2006 | $12,079 +528.1% | $108,698 +513.6% |
| 2005 | $1,923 +6056.1% | $17,716 +6342.2% |
| 2004 | $31 +2.5% | $275 |
| 2003 | $30 | $275 |
Source: MRED as distributed by MLS GRID. This data may not be complete. We recommend contacting the local school district to confirm school assignments for this home.
A local agent can set up tours, give advice and negotiate with sellers.
A local lender can help you make sure your offer is ready when you are.