$362,700
-- bd|-- ba|1.7k sqft
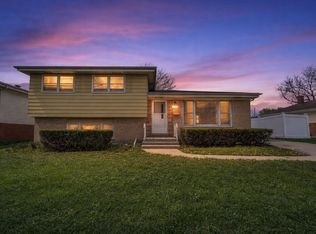
546 N 3rd Ave, Villa Park, IL 60181
Off Market
Zillow last checked:
Jenna Windt (630)232-0021,
Berkshire Hathaway HomeServices Starck Real Estate
Not available
Estimated sales range
Not available
Not available
| Date | Event | Price |
|---|---|---|
| 10/1/2019 | Sold | $250,000-3.8%$156/sqft |
Source: | ||
| 8/29/2019 | Pending sale | $260,000$162/sqft |
Source: G.M. Smith & Son Realtors #10427992 Report a problem | ||
| 8/23/2019 | Price change | $260,000-1.9%$162/sqft |
Source: G.M. Smith & Son Realtors #10427992 Report a problem | ||
| 7/11/2019 | Price change | $265,000-1.1%$165/sqft |
Source: G.M. Smith & Son Realtors #10427992 Report a problem | ||
| 6/24/2019 | Price change | $268,000+4.5%$167/sqft |
Source: G.M. Smith & Son Realtors #10427992 Report a problem | ||
| 6/7/2019 | Price change | $256,500-1.2%$160/sqft |
Source: Owner Report a problem | ||
| 6/2/2019 | Price change | $259,500-1.7%$162/sqft |
Source: Owner Report a problem | ||
| 5/29/2019 | Price change | $264,000-0.4%$165/sqft |
Source: Owner Report a problem | ||
| 5/1/2019 | Price change | $265,000-3.6%$165/sqft |
Source: Owner Report a problem | ||
| 4/16/2019 | Price change | $275,000-2.5%$172/sqft |
Source: Owner Report a problem | ||
| 4/5/2019 | Listed for sale | $282,000+24.2%$176/sqft |
Source: Owner Report a problem | ||
| 7/29/2016 | Sold | $227,000-4.4%$142/sqft |
Source: | ||
| 6/14/2016 | Pending sale | $237,500$148/sqft |
Source: G.M. Smith & Son Realtors #09234923 Report a problem | ||
| 6/10/2016 | Listed for sale | $237,500$148/sqft |
Source: G.M. Smith & Son Realtors #09234923 Report a problem | ||
| 6/4/2016 | Pending sale | $237,500$148/sqft |
Source: G.M. Smith & Son Realtors #09234923 Report a problem | ||
| 5/23/2016 | Listed for sale | $237,500+77.2%$148/sqft |
Source: G.M. Smith & Son Realtors #09234923 Report a problem | ||
| 7/24/2015 | Sold | $134,000-9.2%$84/sqft |
Source: Public Record Report a problem | ||
| 6/9/2015 | Pending sale | $147,500$92/sqft |
Source: Crosstown Realtors Inc. #08927110 Report a problem | ||
| 5/19/2015 | Listed for sale | $147,500-25.9%$92/sqft |
Source: Crosstown Realtors Inc. #08927110 Report a problem | ||
| 11/4/2002 | Sold | $199,000$124/sqft |
Source: Public Record Report a problem | ||
| Year | Property taxes | Tax assessment |
|---|---|---|
| 2024 | $6,299 +5.2% | $91,346 +8.1% |
| 2023 | $5,988 +2.4% | $84,470 +4% |
| 2022 | $5,846 +4.3% | $81,190 +2.6% |
| 2021 | $5,605 +2.5% | $79,170 +2.2% |
| 2020 | $5,470 +7.2% | $77,440 +5.2% |
| 2019 | $5,102 +7.4% | $73,630 +13% |
| 2018 | $4,750 +2.6% | $65,140 +4.9% |
| 2017 | $4,629 +3.1% | $62,070 +6.1% |
| 2016 | $4,491 +1.7% | $58,480 +7.3% |
| 2015 | $4,416 -18.1% | $54,480 -16.7% |
| 2014 | $5,390 +4.9% | $65,400 -1.4% |
| 2013 | $5,139 +2.3% | $66,330 -6.2% |
| 2012 | $5,025 +5.1% | $70,700 -7.9% |
| 2011 | $4,779 +0.8% | $76,770 -7.9% |
| 2010 | $4,739 +2.6% | $83,320 -6.8% |
| 2009 | $4,619 +2% | $89,400 |
| 2008 | $4,526 +6.4% | $89,400 +8.8% |
| 2007 | $4,252 +2.8% | $82,170 +5.3% |
| 2006 | $4,135 +4.6% | $78,040 +6.9% |
| 2005 | $3,954 +4.2% | $73,000 +6.3% |
| 2004 | $3,794 +2.9% | $68,670 +10.1% |
| 2003 | $3,686 +22.4% | $62,370 +24.4% |
| 2002 | $3,013 +3% | $50,140 +8.7% |
| 2001 | $2,926 +2.2% | $46,110 +5.2% |
| 2000 | $2,862 | $43,830 |
Source: MRED as distributed by MLS GRID. This data may not be complete. We recommend contacting the local school district to confirm school assignments for this home.
A local agent can set up tours, give advice and negotiate with sellers.
A local lender can help you make sure your offer is ready when you are.