$--
-- bd|-- ba|-- sqft
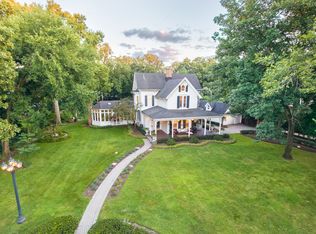
11361 W Plainfield Rd, La Grange, IL 60525
Off Market
Zillow last checked:
John Brannen 708-246-3737,
James Douglas & Associates Inc
Not available
Estimated sales range
Not available
Not available
| Date | Event | Price |
|---|---|---|
| 5/26/2026 | Listing removed | $1,525,000$318/sqft |
Source: MRED as distributed by MLS GRID #12637768 Report a problem | ||
| 5/4/2026 | Listed for sale | $1,525,000$318/sqft |
Source: | ||
| 5/4/2026 | Listing removed | $1,525,000$318/sqft |
Source: | ||
| 4/28/2026 | Price change | $1,525,000-2.6%$318/sqft |
Source: | ||
| 4/15/2026 | Listed for sale | $1,565,000-2.1%$326/sqft |
Source: | ||
| 4/15/2026 | Listing removed | $1,599,000$333/sqft |
Source: | ||
| 3/11/2026 | Listed for sale | $1,599,000-3.1%$333/sqft |
Source: | ||
| 3/11/2026 | Listing removed | $1,650,000$344/sqft |
Source: | ||
| 2/21/2026 | Listed for sale | $1,650,000-5.7%$344/sqft |
Source: | ||
| 2/1/2026 | Listing removed | $1,750,000$365/sqft |
Source: | ||
| 12/19/2025 | Price change | $1,750,000-2.8%$365/sqft |
Source: | ||
| 10/31/2025 | Listed for sale | $1,800,000+9.1%$375/sqft |
Source: | ||
| 8/26/2025 | Listing removed | $1,650,000$344/sqft |
Source: | ||
| 6/4/2025 | Listed for sale | $1,650,000-5.7%$344/sqft |
Source: | ||
| 10/14/2024 | Listing removed | $11,500$2/sqft |
Source: Zillow Rentals Report a problem | ||
| 5/14/2024 | Listing removed | -- |
Source: | ||
| 5/10/2024 | Listing removed | -- |
Source: Zillow Rentals Report a problem | ||
| 5/9/2024 | Price change | $1,750,000-1.4%$365/sqft |
Source: | ||
| 4/9/2024 | Price change | $1,775,000-1.1%$370/sqft |
Source: | ||
| 2/12/2024 | Listed for sale | $1,795,000+35.5%$374/sqft |
Source: | ||
| 1/14/2024 | Listed for rent | $11,500$2/sqft |
Source: Zillow Rentals Report a problem | ||
| 4/8/2023 | Listing removed | -- |
Source: | ||
| 3/28/2023 | Price change | $1,325,000-1.9%$276/sqft |
Source: | ||
| 3/15/2023 | Listed for sale | $1,350,000$281/sqft |
Source: | ||
| Year | Property taxes | Tax assessment |
|---|---|---|
| 2024 | -- | $103,899 +0% |
| 2023 | $23,918 -10.1% | $103,898 +7.1% |
| 2022 | $26,607 +5.2% | $97,020 |
| 2021 | $25,287 +2.4% | $97,020 |
| 2020 | $24,697 -1.5% | $97,020 -1.2% |
| 2019 | $25,076 +5.6% | $98,178 |
| 2018 | $23,742 +2.8% | $98,178 |
| 2017 | $23,096 +16.7% | $98,178 +29.6% |
| 2016 | $19,794 +1.8% | $75,753 |
| 2015 | $19,450 +1.3% | $75,753 |
| 2014 | $19,197 +23.2% | $75,753 +16.3% |
| 2013 | $15,582 +3.5% | $65,110 |
| 2012 | $15,053 +3.2% | $65,110 |
| 2011 | $14,587 -4.5% | $65,110 -18.7% |
| 2010 | $15,280 +3.5% | $80,076 |
| 2009 | $14,761 +8.1% | $80,076 -7% |
| 2008 | $13,650 -2.7% | $86,104 +5.9% |
| 2007 | $14,033 +2.4% | $81,322 |
| 2006 | $13,701 +1.3% | $81,322 |
| 2005 | $13,527 +35.5% | $81,322 +59.6% |
| 2004 | $9,983 +2.5% | $50,961 |
| 2003 | $9,740 +2.5% | $50,961 |
| 2002 | $9,498 +11.4% | $50,961 +13.2% |
| 2001 | $8,524 +34.7% | $45,000 |
| 2000 | $6,326 +0% | $45,000 +33.8% |
| 1999 | $6,326 | $33,642 |
Find assessor info on the county website
Source: MRED as distributed by MLS GRID. This data may not be complete. We recommend contacting the local school district to confirm school assignments for this home.
A local agent can set up tours, give advice and negotiate with sellers.