$353,300
2 bd|2 ba|1.4k sqft
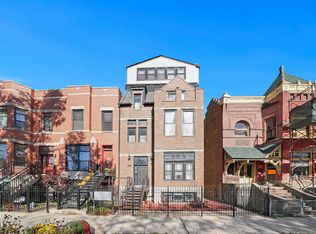
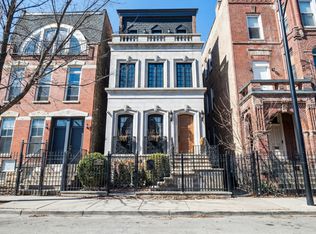
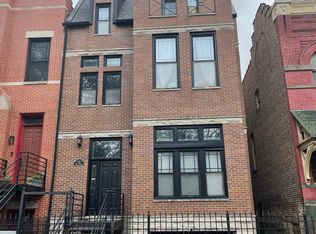
2152 W Monroe St UNIT 1, Chicago, IL 60612
Off Market
Zillow last checked:
Listing updated:
Mike Santore 847-772-5626,
Keller Williams Thrive
$2,168,300
$2.06M - $2.28M
$5,376/mo
| Date | Event | Price |
|---|---|---|
| 4/9/2026 | Price change | $2,285,000-0.4%$637/sqft |
Source: | ||
| 1/27/2026 | Listed for sale | $2,295,000+4.6%$640/sqft |
Source: | ||
| 1/16/2026 | Listing removed | $13,500$4/sqft |
Source: MRED as distributed by MLS GRID #12418999 Report a problem | ||
| 12/18/2025 | Price change | $13,500-1.8%$4/sqft |
Source: MRED as distributed by MLS GRID #12418999 Report a problem | ||
| 9/8/2025 | Price change | $13,750-5.2%$4/sqft |
Source: MRED as distributed by MLS GRID #12418999 Report a problem | ||
| 7/16/2025 | Listed for rent | $14,500$4/sqft |
Source: MRED as distributed by MLS GRID #12418999 Report a problem | ||
| 5/31/2025 | Listing removed | $2,195,000$612/sqft |
Source: | ||
| 1/8/2025 | Listed for sale | $2,195,000+575.4%$612/sqft |
Source: | ||
| 2/28/2020 | Sold | $325,000$91/sqft |
Source: | ||
| 9/27/2019 | Pending sale | $325,000$91/sqft |
Source: Exit Strategy Realty #10521981 Report a problem | ||
| 9/18/2019 | Listed for sale | $325,000$91/sqft |
Source: Exit Strategy Realty #10521981 Report a problem | ||
| Year | Property taxes | Tax assessment |
|---|---|---|
| 2024 | -- | $139,000 +59.8% |
| 2023 | $18,419 +2.6% | $87,000 |
| 2022 | $17,955 +2.3% | $87,000 |
| 2021 | $17,552 +3.9% | $87,000 +15.2% |
| 2020 | $16,886 +0.9% | $75,548 -9% |
| 2019 | $16,735 +1.7% | $83,019 |
| 2018 | $16,452 +57.1% | $83,019 +71.3% |
| 2017 | $10,469 +61.2% | $48,467 +49.5% |
| 2016 | $6,494 +9.3% | $32,422 |
| 2015 | $5,941 +10.4% | $32,422 +11.8% |
| 2014 | $5,380 +2% | $28,997 |
| 2013 | $5,274 +1.4% | $28,997 |
| 2012 | $5,203 -10.5% | $28,997 -19.2% |
| 2011 | $5,815 -0.4% | $35,887 |
| 2010 | $5,840 +4.4% | $35,887 |
| 2009 | $5,596 -5.8% | $35,887 -13.3% |
| 2008 | $5,939 +1% | $41,401 |
| 2007 | $5,880 -1.1% | $41,401 |
| 2006 | $5,943 +147.7% | $41,401 +182% |
| 2005 | $2,399 +1% | $14,682 |
| 2004 | $2,375 +86.2% | $14,682 |
| 2003 | $1,275 -5.4% | $14,682 +57.4% |
| 2002 | $1,348 -16.5% | $9,327 |
| 2001 | $1,615 +86.6% | $9,327 |
| 2000 | $866 | $9,327 +107% |
| 1999 | $866 | $4,506 |
Find assessor info on the county website
Source: MRED as distributed by MLS GRID. This data may not be complete. We recommend contacting the local school district to confirm school assignments for this home.
A local agent can set up tours, give advice and negotiate with sellers.