Property Features:
??? 3 spacious bedrooms
?? 2 full bathrooms
?? Large bonus room – perfect for a 4th bedroom, playroom, home office, or entertainment space!
?? Large screened-in back porch – perfect for relaxing or entertaining
?? Detached workshop/storage shed
?? Spacious yard
?? Located in the desirable Mimosa Subdivision in Luling
For sale by owner
$290,000
324 River Oaks Dr, Luling, LA 70070
3beds
2baths
2,127sqft
SingleFamily
Built in 1965
9,436 Square Feet Lot
$255,800 Zestimate®
$136/sqft
$-- HOA
What's special
Spacious yardLarge bonus roomLarge screened-in back porch
- 1 day
- 201
- 14
Listed by:
Property Owner (504) 722-6502
Facts & features
Interior
Bedrooms & bathrooms
- Bedrooms: 3
- Bathrooms: 2
Heating
- Electric
Cooling
- Central
Appliances
- Included: Dishwasher, Microwave, Range / Oven
Features
- Flooring: Carpet, Laminate
- Basement: None
Interior area
- Total interior livable area: 2,127 sqft
Property
Parking
- Total spaces: 4
- Parking features: Off-street
Features
- Exterior features: Brick
- View description: None
Lot
- Size: 9,436 Square Feet
Details
- Parcel number: 705500F00007
Construction
Type & style
- Home type: SingleFamily
Materials
- Roof: Shake / Shingle
Condition
- New construction: No
- Year built: 1965
Community & HOA
Location
- Region: Luling
Financial & listing details
- Price per square foot: $136/sqft
- Tax assessed value: $211,900
- Annual tax amount: $1,384
- Date on market: 10/20/2026
Estimated market value
$255,800
$223,000 - $289,000
$1,942/mo
Price history
| Date | Event | Price |
|---|---|---|
| 10/20/2026 | Listed for sale | $290,000+205.3%$136/sqft |
Source: Owner Report a problem | ||
| 10/10/2026 | Listing removed | $2,000$1/sqft |
Source: GSREIN #2557784 Report a problem | ||
| 7/26/2026 | Price change | $2,000-9.1%$1/sqft |
Source: GSREIN #2557784 Report a problem | ||
| 5/26/2026 | Price change | $2,200-12%$1/sqft |
Source: GSREIN #2557784 Report a problem | ||
| 5/13/2026 | Listed for rent | $2,500$1/sqft |
Source: GSREIN #2557784 Report a problem | ||
| 4/3/2025 | Listing removed | $2,500$1/sqft |
Source: Zillow Rentals Report a problem | ||
| 2/27/2025 | Listed for rent | $2,500$1/sqft |
Source: Zillow Rentals Report a problem | ||
| 7/17/2020 | Sold | -- |
Source: Public Record Report a problem | ||
| 5/3/2010 | Sold | -- |
Source: Public Record Report a problem | ||
| 12/12/2009 | Price change | $95,000-44.1%$45/sqft |
Source: Taylor, Bean & Whitaker Report a problem | ||
| 7/28/2009 | Listed for sale | $170,000$80/sqft |
Source: Taylor, Bean & Whitaker Report a problem | ||
| 4/17/2009 | Listing removed | $170,000$80/sqft |
Source: Taylor, Bean & Whitaker Report a problem | ||
| 4/3/2008 | Listed for sale | $170,000$80/sqft |
Source: Sellstate Achievers Report a problem | ||
| 5/30/2006 | Sold | -- |
Source: Public Record Report a problem | ||
Public tax history
| Year | Property taxes | Tax assessment |
|---|---|---|
| 2025 | $1,384 -1.5% | $21,190 |
| 2024 | $1,405 +49.3% | $21,190 +33% |
| 2023 | $941 -49.5% | $15,930 |
| 2022 | $1,863 +28.6% | $15,930 +29.7% |
| 2021 | $1,449 -23% | $12,285 -22.9% |
| 2020 | $1,882 +0.1% | $15,930 +0.5% |
| 2019 | $1,880 +0.8% | $15,850 |
| 2018 | $1,865 +89.8% | $15,850 |
| 2017 | $983 +0.1% | $15,850 |
| 2016 | $981 -0.4% | $15,850 +14.8% |
| 2015 | $986 +37.9% | $13,807 |
| 2014 | $715 -0.4% | $13,807 |
| 2013 | $717 -0.2% | $13,807 |
| 2012 | $718 -0.8% | $13,807 |
| 2011 | $724 -54.2% | $13,807 |
| 2010 | $1,580 -1.2% | $13,807 -1.3% |
| 2009 | $1,600 | $13,995 |
| 2008 | -- | $13,995 -10% |
| 2007 | $940 | $15,550 |
| 2006 | -- | $15,550 -88.8% |
| 2005 | -- | $138,600 |
| 2004 | -- | $138,600 +1000% |
| 2003 | $591 -1.6% | $12,600 |
| 2002 | $600 +0.6% | $12,600 |
| 2001 | $597 | $12,600 +100% |
| 2000 | -- | $6,300 |
Find assessor info on the county website
Monthly payment
Est. payment
Payment breakdown
Explore the cost of this home by adjusting the details. Changes won't be saved.Climate risks
Neighborhood: 70070


Similar homes
- $390,0005 bd3 ba2.4k sqft129 Saint Anthony St, Luling, LA 70070For Sale
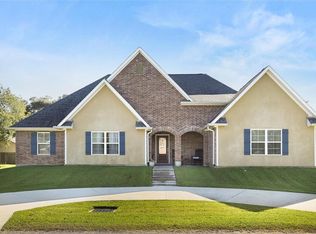
 MLS ID #2580603, Brandy Nichols, Brandy Nichols Realty. GSREIN
- $329,0004 bd3 ba2.1k sqft313 Santa Cruz Ct, Luling, LA 70070For Sale
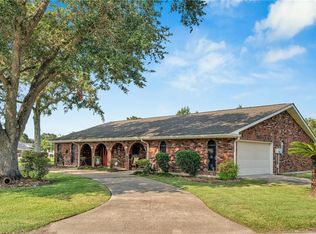 MLS ID #2574724, Regina Allemand, Compass Destrehan. GSREIN
- $289,5004 bd2 ba1.8k sqft514 Milling Ave, Luling, LA 70070For Sale
 MLS ID #2563696, Regina Allemand, Compass Destrehan. GSREIN
- $295,0003 bd3 ba1.8k sqft135 Lawrence Dr, Luling, LA 70070For Sale
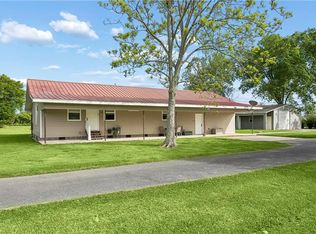 MLS ID #2551489, Kristin Bellanger, Upmarket Realty L.L.C.. GSREIN
- $269,0004 bd3 ba2.7k sqft106 Flowerwood Ct, Luling, LA 70070For Sale
 MLS ID #2026010153, Leslie Doyle, Paige Knobles Properties. ROAM MLS
- $239,0003 bd2 ba1.5k sqft202 6th St, Luling, LA 70070For SaleMLS ID #2581925, Ann Garsaud, United Real Estate Partners. GSREIN
- $335,0003 bd3 ba2k sqft24 W Levert Dr, Luling, LA 70070For SaleMLS ID #2579740, Lisa Ledet, KELLER WILLIAMS REALTY 455-0100. GSREIN
- $359,0004 bd2 ba2.5k sqft414 Monsanto Ave, Luling, LA 70070For SaleMLS ID #2569739, April Brown, Hospitality Realty. GSREIN
- $255,0003 bd2 ba1.6k sqft129 Celia Dr, Luling, LA 70070For SaleMLS ID #2572601, Chantel Tetreault, 1 Percent Lists United. GSREIN
- $248,0003 bd3 ba1.4k sqft20 Francis Ln, Luling, LA 70070For SaleMLS ID #2578198, Amy Barrios, Compass Destrehan. GSREIN
- $249,0003 bd2 ba1.7k sqft402 Barton Ave, Luling, LA 70070For SaleMLS ID #2573577, Jennifer Perkins, Mirambell Realty. GSREIN
- $279,0004 bd2 ba2.1k sqft604 Willowdale Blvd, Luling, LA 70070For SaleMLS ID #2532709, Alison Wilhite, Upmarket Realty L.L.C.. GSREIN
- $285,0003 bd3 ba2k sqft6 Palmer Dr, Luling, LA 70070For SaleMLS ID #2546157, Grant Hebert, Compass Destrehan. GSREIN
- $260,0004 bd2 ba1.9k sqft108 Ashland Dr, Luling, LA 70070For SaleMLS ID #2547896, Brandy Nichols, Brandy Nichols Realty. GSREIN
- $249,0003 bd2 ba1.3k sqft305 Allie Ln, Luling, LA 70070For SaleMLS ID #2580595, Brandy Nichols, Brandy Nichols Realty. GSREIN
- $272,5003 bd2 ba1.4k sqft914 Gassen St, Luling, LA 70070For SaleMLS ID #2570778, Monique Gros, Compass Destrehan. GSREIN
- $279,9003 bd2 ba1.3k sqft107 Louis The 1st St, Luling, LA 70070For SaleMLS ID #2576487, Andi Knox, Knox Real Estate Group. GSREIN
- $369,0003 bd2 ba2.1k sqft104 Bocage Dr, Luling, LA 70070For SaleMLS ID #2568449, Wendy Benedetto, Mirambell Realty. GSREIN
- $277,4993 bd2 ba1.5k sqft135 Antoine Ln, Luling, LA 70070New ConstructionMLS ID #2578212, Amy Barrios, Compass Destrehan. GSREIN
