Rental duplex ready to go! Rental income is $2,150 per month! Tenant pays $1,350 per month on the 4020 side and then $800 per month on the 4018 side. 4018 is on a month to month lease and 4020 has a lease until 3/31/27. Showings with an accepted offer. Buyer will then have a negotiated due diligence period to view property once offer has been accepted - investors only - you can bring contractors through during your due diligence period. This is a working rental. Please reach out to the listing agent and he can send you videos.
Active
$325,000
4018 Byram Ave, Indianapolis, IN 46208
4beds
2baths
--sqft
Multi Family, Duplex
Built in 1935
-- sqft lot
$-- Zestimate®
$--/sqft
$-- HOA
What's special
- 8 days
- 142
- 8
Likely to sell faster than
Zillow last checked:
Listing updated:
Listed by:
Joe Everhart joe@everhartlistings.com,
Everhart Studio, Ltd.,
Quinn Demaree,
Everhart Studio, Ltd.
Source: MIBOR as distributed by MLS GRID,MLS#: 22133468
Facts & features
Interior
Bedrooms & bathrooms
- Bedrooms: 4
- Bathrooms: 2
Appliances
- Laundry: Other
Features
- Has basement: Yes
Property
Parking
- Details: Unit Parking(On Street)
Features
- Levels: Two
- Stories: 2
Lot
- Features: Storm Sewer
Details
- Parcel number: 490614125328000801
Construction
Type & style
- Home type: MultiFamily
- Property subtype: Multi Family, Duplex
Materials
- Aluminum Siding, Brick
Condition
- New construction: No
- Year built: 1935
Community & HOA
Community
- Subdivision: No Subdivision
Location
- Region: Indianapolis
Financial & listing details
- Tax assessed value: $134,800
- Annual tax amount: $6,480
- Date on market: 10/26/2026
- Cumulative days on market: 10 days
Estimated market value
Not available
Estimated sales range
Not available
Not available
Price history
| Date | Event | Price |
|---|---|---|
| 10/26/2026 | Listed for sale | $325,000-16.7% |
Source:  MIBOR as distributed by MLS GRID #22133468 Report a problem | ||
| 1/31/2024 | Sold | $390,000+21.9% |
Source: Public Record Report a problem | ||
| 6/30/2023 | Sold | $320,000+481.8% |
Source: Public Record Report a problem | ||
| 2/1/2016 | Listing removed | $600 |
Source: Athena Real Estate Services Report a problem | ||
| 1/27/2016 | Listed for rent | $600-7.7% |
Source: Athena Real Estate Services Report a problem | ||
| 7/11/2014 | Listing removed | $650 |
Source: Zillow Rental Network Report a problem | ||
| 5/17/2014 | Listed for rent | $650 |
Source: Zillow Rental Network Report a problem | ||
| 2/20/2014 | Sold | $55,000 |
Source: Public Record Report a problem | ||
Public tax history
| Year | Property taxes | Tax assessment |
|---|---|---|
| 2025 | $2,769 | $134,800 +15.5% |
| 2024 | -- | $116,700 -53.8% |
| 2023 | $5,494 +22.3% | $252,500 +8.5% |
| 2022 | $4,494 +14.2% | $232,700 +19.5% |
| 2021 | $3,934 +8.5% | $194,800 +14.7% |
| 2020 | $3,626 +6.6% | $169,900 +10.6% |
| 2019 | $3,402 +6% | $153,600 +7.6% |
| 2018 | $3,208 +0.8% | $142,800 -3.6% |
| 2017 | $3,184 +6.2% | $148,100 |
| 2016 | $2,998 +4.1% | $148,100 +11.2% |
| 2014 | $2,880 +69.6% | $133,200 +6.8% |
| 2013 | $1,698 | $124,700 +7.6% |
| 2012 | $1,698 | $115,900 +13.5% |
| 2011 | -- | $102,100 |
| 2010 | $1,362 -1.3% | $102,100 -2.9% |
| 2009 | $1,380 | $105,100 -3.7% |
| 2007 | -- | $109,100 -34.4% |
| 2006 | -- | $166,300 +140% |
| 2005 | -- | $69,300 |
| 2004 | -- | $69,300 |
| 2003 | -- | $69,300 +67.4% |
| 2002 | -- | $41,400 +200% |
| 2001 | -- | $13,800 |
| 2000 | -- | $13,800 |
Find assessor info on the county website
Monthly payment
Est. payment
Payment breakdown
Explore the cost of this home by adjusting the details. Changes won't be saved.Climate risks
Neighborhood: Butler-Tarkington



Similar homes
- $299,0004 bd2 ba2.6k sqft427 W 42nd St, Indianapolis, IN 46208Active
 MLS ID #22121334, Bailey Braunecker, eXp Realty, LLC. MIBOR as distributed by MLS GRID
- $275,0004 bd2 ba-- sqft3329-3331 Boulevard Pl, Indianapolis, IN 46208Active
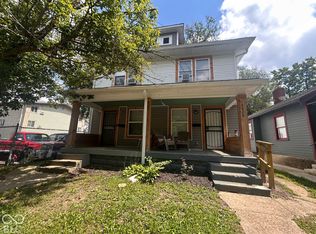 MLS ID #22133453, Joe Everhart, Everhart Studio, Ltd.. MIBOR as distributed by MLS GRID
- $359,9994 bd3 ba-- sqft713 W 32nd St, Indianapolis, IN 46208Active
 MLS ID #22129108, Shannon McGibboney, Carpenter, REALTORS®. MIBOR as distributed by MLS GRID
- $309,0003 bd3 ba2.1k sqft4125 Clarendon Rd, Indianapolis, IN 46208Active
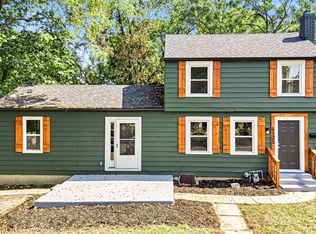 MLS ID #22125908, Gina Fosso-Schibley, eXp Realty LLC. MIBOR as distributed by MLS GRID
