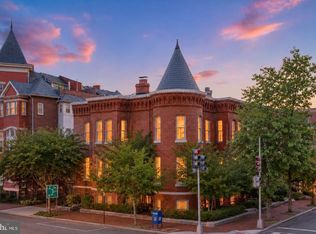
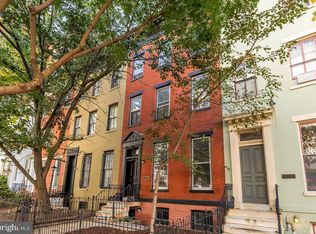
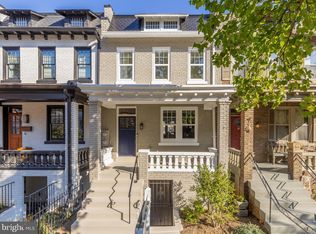
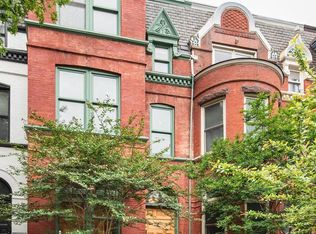
$1,409,600
5 bd2 ba2k sqft
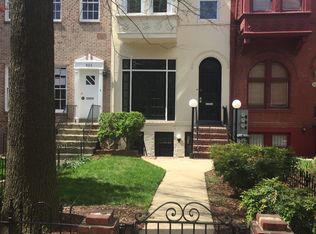
439 New Jersey Ave SE, Washington, DC 20003
Off Market
Zillow last checked:
Listing updated:
Kris Walker 703-981-7802,
KW United,
Listing Team: The Walker Team

Not available
Estimated sales range
Not available
Not available
| Date | Event | Price |
|---|---|---|
| 11/5/2026 | Listed for sale | $3,000,000$885/sqft |
Source:  Bright MLS #DCDC2289028 Report a problem | ||
| Year | Property taxes | Tax assessment |
|---|---|---|
| 2026 | $5,968 +1.8% | $1,573,920 +1.1% |
| 2025 | $5,860 +1.8% | $1,556,970 +1.3% |
| 2024 | $5,756 +1.8% | $1,537,410 +3.3% |
| 2023 | $5,656 +1.6% | $1,488,270 +5.8% |
| 2022 | $5,567 +4.8% | $1,406,390 +5.5% |
| 2021 | $5,312 +4.9% | $1,332,770 +2.6% |
| 2020 | $5,061 +9% | $1,298,910 +11.4% |
| 2018 | $4,644 +2.8% | $1,166,140 +2.7% |
| 2017 | $4,519 +7% | $1,135,650 +6.6% |
| 2016 | $4,224 +6.3% | $1,065,650 +5.9% |
| 2015 | $3,973 +7% | $1,006,300 +6.6% |
| 2014 | $3,715 -1.2% | $944,310 -1.5% |
| 2013 | $3,759 +9.8% | $958,590 -2.2% |
| 2012 | $3,423 | $980,400 |
| 2011 | $3,423 +21% | $980,400 -3.5% |
| 2010 | $2,829 -26.7% | $1,015,980 -4.8% |
| 2009 | $3,858 -13.5% | $1,067,320 +12% |
| 2007 | $4,459 +5.2% | $952,710 +20.7% |
| 2006 | $4,238 -9.9% | $789,120 +10.8% |
| 2005 | $4,701 +12% | $712,140 +20.7% |
| 2004 | $4,197 +12% | $589,820 +2% |
| 2003 | $3,748 +25% | $578,490 +69% |
| 2002 | $2,998 | $342,299 |
| 2001 | $2,998 | $342,299 |
Source: Bright MLS. This data may not be complete. We recommend contacting the local school district to confirm school assignments for this home.

A local agent can set up tours, give advice and negotiate with sellers.