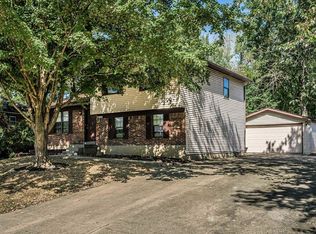
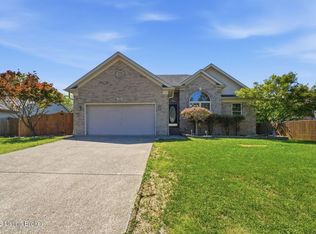
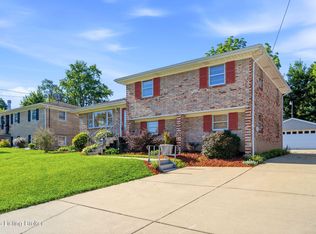
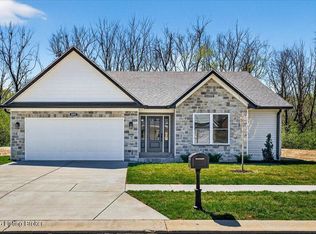
This 1988 square foot single family home has 3 bedrooms and 2.5 bathrooms. This home is located at 7308 Quindero Run Rd, Louisville, KY 40228.
Pre-foreclosure
Est. $322,900
7308 Quindero Run Rd, Louisville, KY 40228
3beds
2baths
1,988sqft
SingleFamily
Built in 2002
9,931 Square Feet Lot
$322,900 Zestimate®
$162/sqft
$-- HOA
Overview
- 139 days |
- 15 |
- 0 |
Facts & features
Interior
Bedrooms & bathrooms
- Bedrooms: 3
- Bathrooms: 2.5
Heating
- Other
Cooling
- Central
Features
- Flooring: Other
Interior area
- Total interior livable area: 1,988 sqft
Property
Parking
- Parking features: Garage - Attached, Off-street
Features
- Exterior features: Other
Lot
- Size: 9,931 Square Feet
Details
- Parcel number: 23338300290000
Construction
Type & style
- Home type: SingleFamily
- Architectural style: Conventional
Materials
- Wood
- Roof: Composition
Condition
- Year built: 2002
Community & HOA
Location
- Region: Louisville
Financial & listing details
- Price per square foot: $162/sqft
- Tax assessed value: $250,000
- Annual tax amount: $2,863
Visit our professional directory to find a foreclosure specialist in your area that can help with your home search.
Find a foreclosure agentForeclosure details
Estimated market value
$322,900
$307,000 - $339,000
$1,973/mo
Price history
| Date | Event | Price |
|---|---|---|
| 3/25/2021 | Sold | $250,000+70.5%$126/sqft |
Source: | ||
| 3/6/2003 | Sold | $146,660$74/sqft |
Source: Public Record Report a problem | ||
Public tax history
| Year | Property taxes | Tax assessment |
|---|---|---|
| 2024 | $2,863 -2.8% | $250,000 |
| 2023 | $2,945 -0.3% | $250,000 |
| 2022 | $2,955 +16.7% | $250,000 +25.9% |
| 2021 | $2,532 +7.4% | $198,620 |
| 2020 | $2,358 | $198,620 |
| 2019 | $2,358 +10.9% | $198,620 |
| 2018 | $2,126 | $198,620 |
| 2017 | $2,126 +45% | $198,620 +35.4% |
| 2013 | $1,467 | $146,660 |
| 2011 | $1,467 | $146,660 |
| 2010 | $1,467 | $146,660 |
| 2009 | $1,467 | $146,660 |
| 2007 | -- | $146,660 |
| 2006 | -- | $146,660 |
| 2005 | -- | $146,660 |
| 2004 | -- | $146,660 |
Find assessor info on the county website
Monthly payment
Estimated monthly payment$1,822
All calculations are estimates and provided by Zillow, Inc. for informational purposes only. Actual amounts may vary.
HOA fees may include property taxes on listings classified as Co-Ops. Contact the listing agent and/or owner for fee details.
Mortgage interest rates are dependent on a number of factors, including credit score, down payment, and repayment length. Interest rate data provided by Zillow Group Marketplace, Inc. as of 1/1/1970 from various mortgage lenders with which we have lead or other similar arrangements; the Estimated Payment is an average of those rates.
See how much you could borrow to make a competitive offer.
Climate risks
Neighborhood: Highview
Nearby schools
GreatSchools rating
- 3/10Smyrna Elementary SchoolGrades: PK-5Distance: 1.1 mi
- 3/10Marion C. Moore SchoolGrades: 6-12Distance: 1 mi


- Kentucky
- Jefferson County
- Louisville
- 40228
- Highview
- 7308 Quindero Run Rd
Nearby cities
Nearby neighborhoods
Nearby zip codes
Other Louisville Topics
