This 4150 square foot single family home has 5 bedrooms and 3.5 bathrooms. This home is located at 8006 S 38th Pl, Phoenix, AZ 85042.
Pre-foreclosure
Est. $1,130,400
8006 S 38th Pl, Phoenix, AZ 85042
5beds
3baths
4,150sqft
SingleFamily
Built in 2002
0.47 Acres Lot
$1,130,400 Zestimate®
$272/sqft
$83/mo HOA
Overview
- 66 days
- 49
- 7
Facts & features
Interior
Bedrooms & bathrooms
- Bedrooms: 5
- Bathrooms: 3.5
Heating
- Forced air, Gas
Cooling
- Central, Other
Appliances
- Included: Dishwasher, Microwave, Range / Oven, Refrigerator
- Laundry: Inside Laundry, Gas Dryer Hookup, 220 V Dryer Hookup
Features
- Flooring: Tile, Carpet
- Has fireplace: Yes
Interior area
- Total interior livable area: 4,150 sqft
Property
Parking
- Total spaces: 8
- Parking features: Garage - Attached
Features
- Exterior features: Wood
- Fencing: Wrought Iron
- Has view: Yes
- View description: Territorial
Lot
- Size: 0.47 Acres
Details
- Parcel number: 30120017
Construction
Type & style
- Home type: SingleFamily
Materials
- Roof: Built-up
Condition
- Year built: 2002
Utilities & green energy
- Sewer: Sewer - Public
- Utilities for property: SRP, SW Gas
Community & HOA
HOA
- Has HOA: Yes
- HOA fee: $83 monthly
Location
- Region: Phoenix
Financial & listing details
- Price per square foot: $272/sqft
- Tax assessed value: $941,300
- Annual tax amount: $7,473
- Ownership: Fee Simple
Foreclosure details
Estimated market value
$1,130,400
$1.02M - $1.27M
$4,437/mo
Price history
| Date | Event | Price |
|---|---|---|
| 5/12/2025 | Listing removed | $1,275,000$307/sqft |
Source:  ARMLS #6745776 Report a problem | ||
| 4/2/2025 | Price change | $1,275,000-5.4%$307/sqft |
Source: ARMLS #6745776 Report a problem | ||
| 1/17/2025 | Price change | $1,348,000-6.9%$325/sqft |
Source: ARMLS #6745776 Report a problem | ||
| 9/5/2024 | Price change | $1,448,000-3.5%$349/sqft |
Source: ARMLS #6745776 Report a problem | ||
| 8/19/2024 | Listed for sale | $1,500,000+97.4%$361/sqft |
Source: ARMLS #6745776 Report a problem | ||
| 8/3/2020 | Sold | $760,000$183/sqft |
Source: ARMLS #6105215 Report a problem | ||
| 7/31/2020 | Pending sale | $760,000$183/sqft |
Source: Cap Core Real Estate #6105215 Report a problem | ||
| 7/18/2020 | Price change | $760,000-1.9%$183/sqft |
Source: Cap Core Real Estate #6105215 Report a problem | ||
| 4/28/2020 | Listed for sale | $775,000+16.7%$187/sqft |
Source: Cap Core Real Estate #6071374 Report a problem | ||
| 4/12/2019 | Sold | $664,000-2.2%$160/sqft |
Source: ARMLS #5877950 Report a problem | ||
| 3/1/2019 | Pending sale | $679,000$164/sqft |
Source: Dempsey Group Realty #5877950 Report a problem | ||
| 2/4/2019 | Listed for sale | $679,000+20507%$164/sqft |
Source: Dempsey Group Realty #5877950 Report a problem | ||
| 10/16/2017 | Listing removed | $3,395$1/sqft |
Source: Homesmart Report a problem | ||
| 9/18/2017 | Listed for rent | $3,395-2.9%$1/sqft |
Source: Homesmart Report a problem | ||
| 8/1/2015 | Listing removed | $3,495$1/sqft |
Source: Home Smart Report a problem | ||
| 7/29/2015 | Sold | $3,295-99.6%$1/sqft |
Source: ARMLS #5296712 Report a problem | ||
| 7/2/2015 | Listed for rent | $3,495$1/sqft |
Source: Homesmart Report a problem | ||
| 8/1/2009 | Listing removed | $799,000$193/sqft |
Source: Linda K. Bechtel #2988716 Report a problem | ||
| 2/14/2009 | Price change | $799,000-8.2%$193/sqft |
Source: Linda K. Bechtel #2988716 Report a problem | ||
| 12/21/2008 | Price change | $870,000-3.2%$210/sqft |
Source: Linda K. Bechtel #2988716 Report a problem | ||
| 8/3/2008 | Price change | $899,000-4.9%$217/sqft |
Source: Linda K. Bechtel #2988716 Report a problem | ||
| 7/1/2008 | Price change | $945,000-5%$228/sqft |
Source: Linda K. Bechtel #2988716 Report a problem | ||
| 5/14/2008 | Listed for sale | $995,000+765.2%$240/sqft |
Source: Keller Williams Realty #2988716 Report a problem | ||
| 5/11/2001 | Sold | $115,000$28/sqft |
Source: Public Record Report a problem | ||
Public tax history
| Year | Property taxes | Tax assessment |
|---|---|---|
| 2025 | $7,473 +2.6% | $94,130 -3.7% |
| 2024 | $7,281 +2.9% | $97,720 +117.4% |
| 2023 | $7,074 +2% | $44,958 -29.3% |
| 2022 | $6,932 +8.6% | $63,570 +1.4% |
| 2021 | $6,385 +3.7% | $62,670 -4% |
| 2020 | $6,160 -6.4% | $65,250 +1% |
| 2019 | $6,578 | $64,630 +47.3% |
| 2018 | $6,578 +4.9% | $43,870 +7.4% |
| 2017 | $6,269 +11.7% | $40,850 +10.1% |
| 2016 | $5,613 +23.9% | $37,100 -22.6% |
| 2015 | $4,529 | $47,950 +65.5% |
| 2014 | -- | $28,980 -10.2% |
| 2013 | -- | $32,270 -3.4% |
| 2012 | -- | $33,420 +41% |
| 2011 | -- | $23,700 -19.1% |
| 2010 | -- | $29,280 -35.2% |
| 2009 | -- | $45,170 -16.1% |
| 2008 | -- | $53,850 +26.3% |
| 2007 | -- | $42,650 +22% |
| 2006 | -- | $34,950 |
| 2005 | -- | $34,950 +15.9% |
| 2004 | -- | $30,150 +124.3% |
| 2003 | -- | $13,440 |
| 2002 | -- | $13,440 |
Find assessor info on the county website
Monthly payment
Climate risks
Neighborhood: South Mountain
Nearby schools
Schools provided by the listing agent
- Elementary: Roosevelt Elementary School
- Middle: Cloves C Campbell Sr Elementary School
- High: South Mountain High School
- District: Phoenix Union High School District (210)
Source: The MLS. This data may not be complete. We recommend contacting the local school district to confirm school assignments for this home.
Similar homes
- $850,0004 bd4 ba2.7k sqft916 E BUIST Avenue, Phoenix, AZ 85042For Sale
 MLS ID #7098007, George Laughton, EveryPlace. ARMLS
- $1,030,0004 bd3 ba3.1k sqft549 E MOUNTAIN SAGE Drive, Phoenix, AZ 85048For Sale
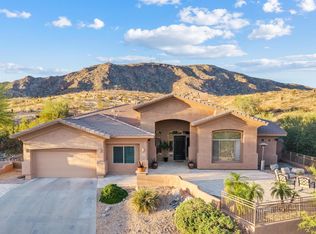 MLS ID #7011670, Stacy Lenz, HomeSmart. ARMLS
- $698,9003 bd3 ba2.9k sqft3034 E Desert Lane, Phoenix, AZ 85042For Sale
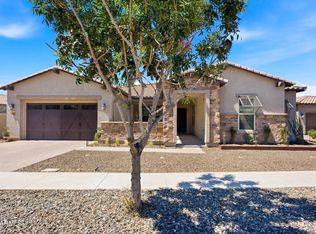 MLS ID #7039865, Peggy Young, RE/MAX Fine Properties. ARMLS
- $770,0004 bd3 ba2.9k sqft521 E MINERAL Road, Phoenix, AZ 85042For Sale
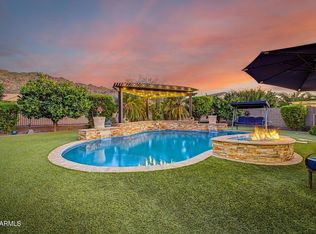 MLS ID #7061525, Lisa A Dixon, HomeSmart. ARMLS
