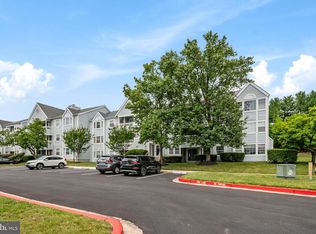
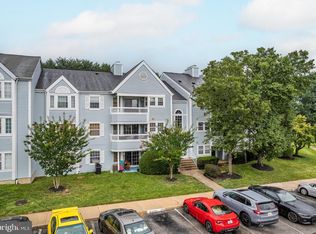
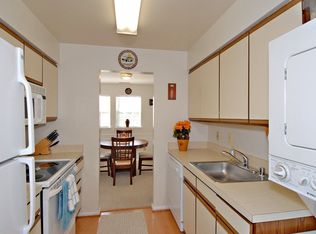
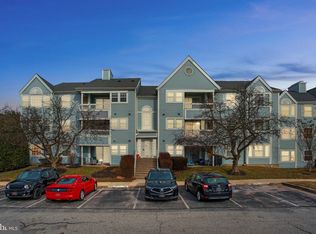
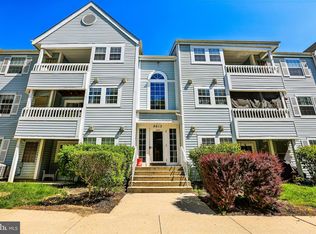
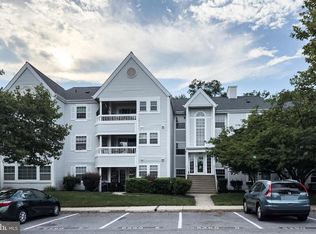
Welcome home to this beautifully updated 2-bedroom, 2-bath condominium in the desirable Village of Montgomery Run. Freshly painted and featuring new luxury vinyl plank flooring throughout, this move-in ready home offers a bright, inviting interior with thoughtful updates, including a new HVAC system (2024), water heater (December 2023), newer in-unit washer and dryer (approximately 3 years old), and a replaced patio sliding door. The spacious primary suite easily accommodates a king-sized bed and features a private en-suite bath and walk-in closet, while the second bedroom comfortably fits a queen-sized bed, making it ideal for guests, a roommate, or a home office. The functional floor plan includes a separate dining area, an entry foyer with a pantry and additional closet storage, and a generous living room that opens to a private patio, creating the perfect space to relax or entertain. Enjoy the convenience of a secured building entrance and an unbeatable Ellicott City location in sought-after Howard County, offering exceptional quality of life with easy access to major commuter routes, shopping, dining, parks, and everyday conveniences. This turnkey home combines modern updates, comfortable living spaces, and a location that's hard to beat.
Under contract
$269,900
8337 Montgomery Run Rd Unit D, Ellicott City, MD 21043
2beds
944sqft
:
Get pre-qualified$2,140/mo
Condominium
Built in 1990
-- sqft lot
$266,900 Zestimate®
$286/sqft
$384/mo HOA
What's special
Walk-in closetSecured building entrancePrivate patioFreshly paintedPrivate en-suite bathBright inviting interiorSeparate dining area
- 14 days |
- 185 |
- 5 |
Zillow last checked:
Listing updated:
Listed by:
Vishal Doddanna 443-718-9646,
Keller Williams Realty Centre 4103120000,
Listing Team: Vidona Group
Source: Bright MLS,MLS#: MDHW2070054
Facts & features
Interior
Bedrooms & bathrooms
- Bedrooms: 2
- Bathrooms: 2
- Full bathrooms: 2
- Main level bathrooms: 2
- Main level bedrooms: 2
Rooms
- Room types: Living Room, Dining Room, Primary Bedroom, Bedroom 2, Kitchen
Primary bedroom
- Level: Main
Bedroom 2
- Level: Main
Dining room
- Level: Main
Kitchen
- Level: Main
Living room
- Level: Main
Heating
- Forced Air, Electric
Cooling
- Central Air, Ceiling Fan(s), Electric
Appliances
- Included: Dishwasher, Disposal, Exhaust Fan, Refrigerator, Washer/Dryer Stacked, Dryer, Washer, Electric Water Heater
- Laundry: Dryer In Unit, Has Laundry, Washer In Unit, In Unit
Features
- Kitchen - Galley, Primary Bath(s), Entry Level Bedroom, Floor Plan - Traditional, Combination Dining/Living, Dining Area, Pantry
- Windows: Window Treatments
- Has basement: No
- Has fireplace: No
Interior area
- Total structure area: 944
- Total interior livable area: 944 sqft
- Finished area above ground: 944
- Finished area below ground: 0
Property
Parking
- Total spaces: 20
- Parking features: General Common Elements, Paved, Parking Lot
Accessibility
- Accessibility features: Accessible Entrance
Features
- Levels: One
- Stories: 1
- Patio & porch: Patio
- Pool features: Community
Details
- Additional structures: Above Grade, Below Grade
- Parcel number: 1401242199
- Zoning: RSA8
- Special conditions: Standard
- Other equipment: Intercom
Construction
Type & style
- Home type: Condo
- Architectural style: Colonial
- Property subtype: Condominium
- Attached to another structure: Yes
Materials
- Vinyl Siding
Condition
- Good
- New construction: No
- Year built: 1990
Utilities & green energy
- Sewer: Public Sewer
- Water: Public
Community & HOA
Community
- Features: Pool
- Security: Main Entrance Lock
- Condo and coop fee: $384 monthly
- Subdivision: Village Of Montgomery Run
HOA
- Has HOA: No
- Amenities included: Common Grounds, Other, Pool
- Services included: Common Area Maintenance, Maintenance Structure, Maintenance Grounds, Insurance, Management, Other, Pool(s)
Location
- Region: Ellicott City
Financial & listing details
- Price per square foot: $286/sqft
- Tax assessed value: $244,400
- Annual tax amount: $3,659
- Date on market: 7/14/2026
- Listing agreement: Exclusive Right To Sell
- Ownership: Condominium
Estimated market value
$266,900
$254,000 - $280,000
$1,982/mo
Price history
| Date | Event | Price |
|---|---|---|
| 7/24/2026 | Contingent | $269,900$286/sqft |
Source: | ||
| 7/17/2026 | Listed for sale | $269,900+54.3%$286/sqft |
Source: | ||
| 3/24/2021 | Listing removed | -- |
Source: Owner Report a problem | ||
| 7/27/2017 | Listing removed | $1,395$1/sqft |
Source: Owner Report a problem | ||
| 6/27/2017 | Listed for rent | $1,395$1/sqft |
Source: Owner Report a problem | ||
| 4/18/2014 | Listing removed | $174,900$185/sqft |
Source: Keller Williams Realty Centre #HW8262171 Report a problem | ||
| 4/9/2014 | Pending sale | $174,900$185/sqft |
Source: Keller Williams Realty Centre #HW8262171 Report a problem | ||
| 4/9/2014 | Listed for sale | $174,900$185/sqft |
Source: Keller Williams - Greater Howard County #HW8262171 Report a problem | ||
| 3/20/2014 | Pending sale | $174,900$185/sqft |
Source: Keller Williams Realty Centre #HW8262171 Report a problem | ||
| 3/20/2014 | Listed for sale | $174,900$185/sqft |
Source: Keller Williams - Greater Howard County #HW8262171 Report a problem | ||
| 3/11/2014 | Pending sale | $174,900$185/sqft |
Source: Keller Williams Realty Centre #HW8262171 Report a problem | ||
| 1/31/2014 | Listed for sale | $174,900-7.9%$185/sqft |
Source: Keller Williams Realty Centre #HW8262171 Report a problem | ||
| 9/30/2009 | Sold | $190,000$201/sqft |
Source: Public Record Report a problem | ||
| 7/26/2009 | Listed for sale | $190,000+26.7%$201/sqft |
Source: RE/MAX ADVANTAGE REALTY #HW7117669 Report a problem | ||
| 2/4/2004 | Sold | $150,000$159/sqft |
Source: Public Record Report a problem | ||
Public tax history
| Year | Property taxes | Tax assessment |
|---|---|---|
| 2025 | -- | $224,900 +9.5% |
| 2024 | $2,313 +10.5% | $205,400 +10.5% |
| 2023 | $2,093 +0.2% | $185,900 |
| 2022 | $2,090 +0.2% | $185,900 +0.3% |
| 2021 | $2,086 +0.2% | $185,300 +0.2% |
| 2020 | $2,083 | $185,000 |
| 2019 | $2,083 -7.4% | $185,000 |
| 2018 | $2,250 -21.7% | $185,000 |
| 2017 | $2,872 | $185,000 +0.5% |
| 2016 | -- | $184,000 +0.5% |
| 2015 | -- | $183,000 +0.5% |
| 2014 | -- | $182,000 |
| 2013 | -- | $182,000 |
| 2012 | -- | $182,000 -14.2% |
| 2011 | -- | $212,000 +0.3% |
| 2010 | -- | $211,332 +0.3% |
| 2009 | -- | $210,666 +0.3% |
| 2008 | -- | $210,000 +22.1% |
| 2007 | -- | $172,000 +28.4% |
| 2006 | -- | $134,000 +39.6% |
| 2005 | -- | $96,000 +7.9% |
| 2004 | -- | $89,000 +8.5% |
| 2003 | -- | $82,000 +9.3% |
| 2002 | -- | $75,000 |
| 2001 | -- | $75,000 |
Find assessor info on the county website
Monthly payment
Est. payment
Payment breakdown
Explore the cost of this home by adjusting the details. Changes won't be saved.Climate risks
Neighborhood: 21043
Nearby schools
GreatSchools rating
- 6/10Ilchester Elementary SchoolGrades: PK-5Distance: 1.5 mi
- 7/10Mayfield Woods Middle SchoolGrades: 6-8Distance: 1.7 mi
- 5/10Long Reach High SchoolGrades: 9-12Distance: 1.2 mi
Schools provided by the listing agent
- Elementary: Waterloo
- Middle: Mayfield Woods
- High: Long Reach
- District: Howard County Public School System
Source: Bright MLS. This data may not be complete. We recommend contacting the local school district to confirm school assignments for this home.
- $310,0003 bd2 ba1k sqft8337 Montgomery Run Rd UNIT C, Ellicott City, MD 21043For Sale
- $267,5002 bd2 ba944 sqft8337 Montgomery Run Rd UNIT I, Ellicott City, MD 21043Sold
- $272,0002 bd2 ba958 sqft8337 Montgomery Run Rd UNIT H, Ellicott City, MD 21043Off Market
- $285,0002 bd2 ba962 sqft8335 Montgomery Run Rd UNIT K, Ellicott City, MD 21043Sold
- $285,0002 bd2 ba944 sqft8341 Montgomery Run Rd UNIT A, Ellicott City, MD 21043Sold
- $290,0002 bd2 ba969 sqft8341 Montgomery Run Rd UNIT I, Ellicott City, MD 21043Sold
- $300,0003 bd2 ba1.1k sqft8347 Montgomery Run Rd UNIT B, Ellicott City, MD 21043Sold
- $270,0002 bd2 ba1k sqft8353 Montgomery Run Rd UNIT C, Ellicott City, MD 21043Sold
A local agent can set up tours, give advice and negotiate with sellers.
Similar homes
- $280,0002 bd2 ba943 sqft8613 Falls Run Rd Unit E, Ellicott City, MD 21043For Sale
 MLS ID #MDHW2068154, Bob Chew, Samson Properties. Bright MLS
 - $310,0003 bd2 ba1k sqft8337 Montgomery Run Rd Unit C, Ellicott City, MD 21043For SaleMLS ID #MDHW2070358, David Natoli, Douglas Realty, LLC. Bright MLS
- $310,0003 bd2 ba1.2k sqft8390 Montgomery Run Rd Unit E, Ellicott City, MD 21043For Sale
 MLS ID #MDHW2070988, Deborah Willis, Weichert Realtors - McKenna & Vane. Bright MLS
 - $220,0002 bd2 ba976 sqftCross Fox, Columbia, MD 21044For Sale
 MLS ID #MDHW2070670, Julie M Kelley, Weichert Realtors - McKenna & Vane. Bright MLS
 - $359,9002 bd2 ba950 sqftWoodland Village, Ellicott City, MD 21043For SaleMLS ID #MDHW2070162, Kevin P Holmes, Samson Properties. Bright MLS
- $269,9002 bd2 ba1.3k sqft7505 Weather Worn Way Unit D, Columbia, MD 21046For SaleMLS ID #MDHW2071218, David Jimenez, RE/MAX Distinctive Real Estate, Inc.. Bright MLS
- $364,9002 bd2 ba1.1k sqft7649 Stony Creek Ln, Ellicott City, MD 21043For SaleMLS ID #MDHW2069780, Rob Culotta, Cummings & Co. Realtors. Bright MLS
- $299,9003 bd2 ba1.2k sqft4990 Dorsey Hall Dr Unit B2, Ellicott City, MD 21042For SaleMLS ID #MDHW2066228, Nancy Hulsman, Coldwell Banker Realty. Bright MLS
- $240,0002 bd2 ba976 sqftCross Fox Condominium ,inc, Columbia, MD 21044For SaleMLS ID #MDHW2065194, Nadia Moreira, Samson Properties. Bright MLS
- $290,0002 bd2 ba1k sqftWestchester, Baltimore, MD 21228For SaleMLS ID #MDBC2165302, Todd Broschart, The KW Collective. Bright MLS
- $200,0002 bd1 ba908 sqftTreover, Columbia, MD 21045For SaleMLS ID #MDHW2071410, Maria Weaver, Cummings & Co. Realtors. Bright MLS
- $375,0002 bd1 ba980 sqft3011 Dexter Dr #1106, Ellicott City, MD 21043For SaleMLS ID #MDHW2071266, ubong Ekpo, Compass. Bright MLS
- $200,0002 bd1 ba889 sqft8870 Spiral Cut Unit G-65, Columbia, MD 21045For SaleMLS ID #MDHW2070440, Kaitlin Fox, Cummings & Co. Realtors. Bright MLS
- $290,0003 bd3 ba1.1k sqft6233 Sandpiper Ct #1, Elkridge, MD 21075For SaleMLS ID #MDHW2071078, Eddie DeLuca, Redfin Corp. Bright MLS
- $279,9002 bd2 ba1k sqftWintergate At Longmead Codm, Silver Spring, MD 20906For SaleMLS ID #MDMC2246452, Frances McGlaughlin, RE/MAX Realty Services. Bright MLS
- $309,9002 bd2 ba1.1k sqft691 Winding Stream Way Unit 202, Odenton, MD 21113For SaleMLS ID #MDAA2152140, Linda Cerulli, CENTURY 21 New Millennium. Bright MLS
- $182,9902 bd1 ba889 sqftLong Reach, Columbia, MD 21045For SaleMLS ID #MDHW2069722, Gregory Osborn, Long & Foster Real Estate, Inc.. Bright MLS
- $320,0002 bd3 ba1.3k sqft1131 Kelfield Dr #1131, Baltimore, MD 21227For SaleMLS ID #MDBC2170586, Joe Bird, Red Cedar Real Estate, LLC. Bright MLS
- $345,0002 bd3 ba1.4k sqft6456 Ducketts Ln Unit 6-2, Elkridge, MD 21075For SaleMLS ID #MDHW2071356, Bob Lucido, Keller Williams Lucido Agency. Bright MLS
- $375,0002 bd2 ba1.2k sqft5824 Wyndham Cir Unit 102, Columbia, MD 21044For SaleMLS ID #MDHW2070530, Lauren Thomas, Compass. Bright MLS
